
Compact design reduces volume by up to 33 percent and lowers environmental impact
")
ABB's latest generation 420 kV GIS (April 2012)
Zurich, Switzerland, April 23, 2012 – ABB, the leading power and automation technology group, announced the launch of its new generation 420kV (kilovolt) Gas Insulated Switchgear (GIS) at the Hannover Fair being held in Germany from 23-27 April 2012. The new design reduces product volume by up to 33 per cent (width x depth x height) compared to its predecessor resulting in a considerably smaller footprint.
The compactness of the unit makes it ideally suited for installations where space is a constraint and also reduces the amount of SF6 insulating gas requirement by as much as 40 percent making it more environmentally friendly. It is also designed to enhance resource efficiency by reducing thermal losses, lowering transportation costs and optimizing investment in infrastructure.
The new GIS can be factory assembled, tested, and shipped as one bay in a container instead of multiple assembly units, saving site installation and commissioning time by up to 40 percent compared with traditional designs. Frontal access to drives, position indicators and service platforms enable easier operation, inspection and maintenance. Standardized modules and connection elements also enable flexibility in terms of configurations and building optimization.
The product features a fast single-interrupter dual motion circuit breaker and has been designed for current ratings up to 5000A (amperes). It is capable of providing protection to power networks with rated short-circuit currents up to 63kA (kilo amperes).
“A compact and more user friendly design, faster on-site commissioning and lower environmental impact are some of the key features of this latest generation of Gas Insulated Switchgear”, said Giandomenico Rivetti, head of ABB’s High Voltage Products business, a part of the company’s Power Products division. “The introduction of this 420kV GIS is part of ABB’s ongoing technology and innovation focus and follows the recent launch of our advanced 245kV and 72.5kV versions.”
In a power system, switchgear is used to control, protect and isolate electrical equipment thereby enhancing the reliability of electrical supply. With GIS technology, key components including contacts and conductors are protected with insulating gas. Compactness, reliability and robustness make this a preferred solution where space is a constraint (e.g. busy cities) or in harsh environmental conditions.
ABB pioneered high-voltage GIS in the mid-1960s and continues to drive technology and innovation, offering a full range product portfolio with voltage levels from 72.5kV to 1,100kV. As a market leader in high-voltage GIS technology, ABB has a global installed base of more than 20,000 bays.
ABB (www.abb.com) is a leader in power and automation technologies that enable utility and industry customers to improve their performance while lowering environmental impact. The ABB Group of companies operates in around 100 countries and employs about 135,000 people.
.
Related articles
- Gas-Insulated Switchgear Type 8DN8
- Substation, Its Function And Types
- GE AKD-20 Low-Voltage Switchgear
- Maintenance Of SF6 Gas Circuit Breakers
- Maintenance Of High Voltage Circuit Breakers
3,216 views

100 kA Superconducting Transformer
In a superconducting transformer the windings, made of a high temperature superconducting material (HTS), are cooled with liquid nitrogen at about 77K so that the resistance is almost negligible. Load losses, even after adding losses from nitrogen processing, can be reduced by 50%.
The use of HTS transformers on a larger scale is economically justified and will become more attractive as cooling systems improve and the cost of liquid nitrogen production falls. Another important factor is progress in the processing of long lengths of HTS conductors.
These transformers have smaller weight and volume and are more resistant to overload but cost about 150% to 200% of the price of conventional transformers. So, in applications where weight is crucial (railway vehicles), transformers are much more “squeezed” (by forced cooling) to cut the weight. So efficiencies are much lower, and saving weight saves energy twice.
In our opinion, HTS transformers are suitable only in applications where the load losses make up a high proportion of the total losses, but are not yet ready for general use.
.
Related articles
- Substation, Its Function And Types
- History Of The Power Substations
- Reduction In The Cost Of Electricity
- Storage Systems
- Connecting Wind Turbines To The Power Grid
3,729 views
 The Colorado Springs lab possessed the largest Tesla Coil ever built, known as the “Magnifying Transmitter”. This was not identical to the classic Tesla Coil. According to accounts, Tesla managed to transmit tens of thousands of watts of power without wires using the magnifier. Tesla posted a large fence around the coil with a sign, “Keep Out – Great Danger”. Tesla’s Magnifying Transmitter, at fifty-two feet in diameter, generated millions of volts of electricity and produced lightning bolts one-hundred-thirty feet long (forty-one metres). It was a three-coil magnifying system requiring alternative forms of analysis than lumped-constant coupled resonant coils presently described to most. The Magnifying Transmitter resonated at a natural quarter wavelength frequency.
Tesla also worked with the magnifying transmitter in a continuous-wave mode and in a damped-wave resonant mode. The Magnifying Transmitter produced thunder which was heard as far away as Cripple Creek. He became the first man to create electrical effects on the scale of lightning.
People near the lab would observe sparks emitting from the ground to their feet and through their shoes. Some people observed electrical sparks from the fire hydrants (Tesla for a time grounded out to the plumbing of the city). The area around the laboratory would glow with a blue corona (similar to St. Elmo’s Fire). One of Tesla’s experiments with the Magnifying Transmitter destroyed Colorado Springs Electric Company’s generator by back feeding the city’s power generators, and blacked out the city.
The city had a backup generator and company officials denied Tesla further access to their feed if he did not repair the city’s primary generator at his own expense. The generator was working again in a few days.
.
Related articles
2,173 views
Good thing is that CsanyiGroup (author of ePlusMenuCAD) has prepared great price for RC1 – 150EUR or $198, which is double less than earlier version 9. By purchasing licence for ePlusMenuCAD 10 RC1 you will get complete version (when released) for free. When complete version come out, price will be like before 290EUR or $38.
Read the full story at EEP – Electrical Engineering Portal
ePlusMenuCAD 10 Changes: (2010/10/24)
- Full support for AutoCAD 2011 and AutoCAD 2010
- Everything translated to english language
- A complete and easy layer and the symbols control in ePlusMenuCAD-in (color, line width, plot…)
- All layer’s color are changed to BYLAYER, instead to specific color (easier for manipulate)
- Completely new layers for all symbols (E-Power-Supply-Sub-Main, E-Power-Enclosure…)
…

ABB is a major transformer manufacturer throughout the world. ABB power transformers are built and designed to meet the individual customer’s needs. This experienced attendance to details lies behind the success of ABB’s transformers.
This approach is carried throughout the manufacturing process: design, core, winding, drying, tank, quality assurance, assembly, testing, transport and installation and support.
.
.
Related articles
- The Unique Role Of Wind Turbine Step-Up (WTSU) Transformers
- Guide To Low Voltage Busbar Trunking Systems (1)
- Substation ventilation
- ABB launches new generation 420kV gas insulated switchgear
- Field Test Procedure For Protective Relays
2,558 views

Figure 1.1 Los Angeles, 1908
Light pollution or sky glow is caused by light aimed directly up into the sky and by light reflected off the ground or objects. Sky glow prevents the general public and astronomers from seeing the stars.
Floodlights, wall packs and other un-shielded luminaires are the major contributors to sky glow. Overlighting, even with shielded luminaires, reflects unnecessary light back into the atmosphere and adds to the sky glow. This often occurs at outdoor areas such as motor pools and sports fields.
To minimize light pollution, use fully shielded luminaires or IESNA full cut-off type for area and roadway lighting as illustrated in Figure 3.

Figure 2. Unshielded and non-cutoff luminaires lead to light pollution.
The use of full cutoff luminaires may reduce uniformity and therefore require greater pole heights or spacing. Cutoff, semi-cutoff, and non-cutoff luminaires may also be used at low mounting heights if the lumen output of the lamp is limited to 4200 lumens.
These applications, such as pedestrian and entry lighting, typically require greater vertical illuminance for facial identity.
")
Figure 1.2 Los Angeles, 1976
Provide uniform low glare lighting and do not overlight exterior areas. Also, control lighting with time clocks, photocells, and motion sensors such that lighting is only energized when needed.
.
Related articles
- Line Protection With Distance Relays
- Little Known Methods to Produce More Efficient Solar Panels
- Siemens MV Topic – Loss Of Vacuum
- LIGHTING FUNDAMENTALS
9,252 views

Line Protection With Distance Relays
Distance relaying should be considered when overcurrent relaying is too slow or is not selective. Distance relays are generally used for phase-fault primary and back-up protection on subtransmission lines, and on transmission lines where high-speed automatic reclosing is not necessary to maintain stability and where the short time delay for end-zone faults can be tolerated.
Overcurrent relays have been used generally for ground-fault primary and back-up protection, but there is a growing trend toward distance relays for ground faults also. Single-step distance relays are used for phase-fault back-up protection at the terminals of generators. Also, single-step distance relays might be used with advantage for back-up protection at power-transformer banks, but at the present such protection is generally provided by inverse-time overcurrent relays. Distance relays are preferred to overcurrent reIays because they are not nearly so much affected by changes in short-circuit-current magnitude as overcurrent relays are, and, hence, are much less affected by changes in generating capacity and in system configuration.
This is because, distance relays achieve selectivity on the basis of impedance rather than current.
The choice between impedance, reactance, or MHO
Because ground resistance can be so variable, a ground distance relay must be practically unaffected by large variations in fault resistance. Consequently, reactance relays are generally preferred for ground relaying. For phase-fault relaying, each type has certain advantages and disadvantages. For very short line sections, the reactance type is preferred for the reason that more of the line can be protected at high speed. This is because the reactance relay is practically unaffected by arc resistance which may be large compared with the line impedance, as described elsewhere in this chapter. On the other hand, reactance-type distance relays at certain locations in a system are the most likely to operate undesirably on severe synchronizing power surges unless additional relay equipment is provided to prevent such operation.
The mho type is best suited for phase-fault relaying for longer lines, and particularly where severe synchronizing-power surges may occur. It is the least likely to require additional equipment to prevent tripping on synchronizing-power surges. When mho relaying is adjusted to protect any given line section, its operating characteristic encloses the least space on the R-X diagram, which means that it will be least affected by abnormal system conditions other than line faults; in other words, it is the most selective of all distance relays.
Because the mho relay is affected by arc resistance more than any other type, it is applied to longer lines. The fact that it combines both the directional and the distancemeasuring functions in one unit with one contact makes it very reliable.
The impedance relay is better suited for phase-fault relaying for lines of moderate length than for either very short or very long lines. Arcs affect an impedance relay more than a reactance relay but less than a mho relay. Synchronizing-power surges affect an impedance relay less than a reactance relay but more than a mho relay. If an impedance-relay characteristic is offset, so as to make it a modified relay, it can be made to resemble either a reactance relay or a mho relay but it will always require a separate directional unit.
There is no sharp dividing line between areas of application where one or another type of distance relay is best suited. Actually, there is much overlapping of these areas. Also, changes that are made in systems, such as the addition of terminals to a line, can change the type of relay best suited to a particular location. Consequently, to realize the fullest capabilities of distance relaying, one should use the type best suited for each application. In some cases much better selectivity can be obtained between relays of the same type, but, if relays are used that are best suited to each line, different types on adjacent lines have no appreciable adverse effect on selectivity.
.
Related articles
- Field Test Procedure For Protective Relays
- ABB Feeder Protection REF615 ANSI
- Busbar Technical Specification
- Maintenance Of Molded Case Circuit Breakers (MCCB)
- ANSI code 50BF – Breaker failure
4,926 views

UPS design criteria and selection
An UPS system is an alternate or backup source of power with the electric utility company being the primary source. The UPS provides protection of load against line frequency variations, elimination of power line noise and voltage transients, voltage regulation, and uninterruptible power for critical loads during failures of normal utility source. An UPS can be considered a source of standby power or emergency power depending on the nature of the critical loads. The amount of power that the UPS must supply also depends on these specific needs.
These needs can include emergency lighting for evacuation, emergency perimeter lighting for security, orderly shut down of manufacturing or computer operations, continued operation of life support or critical medical equipment, safe operation of equipment during sags and brownouts, and a combination of the preceding needs.
The UPS selection process involves several steps as discussed briefly here.
Determine need
Prior to selecting the UPS it is necessary to determine the need. The types of loads may determine whether local, state, or federal laws mandate the incorporation of an UPS. An UPS may be needed for a variety of purposes such as lighting, startup power, transportation, mechanical utility systems, heating, refrigeration, production, fire protection, space conditioning, data processing, communication, life support, or signal circuits.
Some facilities need an UPS for more than one purpose. It is important to determine the acceptable delay between loss of primary power and availability of UPS power, the length of time that emergency or backup power is required, and the criticality of the load that the UPS must bear. All of these factors play into the sizing of the UPS and the selection of the type of the UPS.
Determine safety
It must be determined if the safety of the selected UPS is acceptable. The UPS may have safety issues such as hydrogen accumulation from batteries, or noise pollution from solid-state equipment or rotating equipment. These issues may be addressed through proper precautions or may require a selection of a different UPS.
Determine availability
The availability of the selected UPS must be acceptable. The criticality of the loads will determine the necessary availability of the UPS. The availability of an UPS may be improved by using different configurations to provide redundancy. It should be noted that the C4ISR facilities require a reliability level of 99.9999 percent.
Determine maintainability
The selected UPS must be maintainable. Maintenance of the unit is important in assuring the unit’s availability. If the unit is not properly cared for, the unit will be more likely to fail. Therefore, it is necessary that the maintenance be performed as required. If the skills and resources required for the maintenance of the unit are not available, it may be necessary to select a unit requiring less maintenance.
Determine if affordable
The selected UPS must be affordable. While this is the most limiting factor in the selection process, cost cannot be identified without knowing the other parameters. The pricing of the unit consists of the equipment cost as well as the operating and maintenance costs. Disposal costs of the unit should also be considered for when the unit reaches the end of its life.
Re-evaluate steps
If these criteria are not met, another UPS system must be selected and these steps re-evaluated.
.
Related articles
- Maintenance Of Molded Case Circuit Breakers (MCCB)
- Line Protection With Distance Relays
- Arc-resistant low voltage switchgear
- What is PowerLogic System?
- Substation, Its Function And Types
3,132 views

The New ETS4: Easy, Fast, Open
Singapore, Los Angeles, Johannesburg, London, Berlin, Moscow – building automation engineers from all over the world, use ETS as product and manufacturer independent programming tool in order to increase energy efficiency of buildings. This standardised tool is currently available in 15 languages, and supports KNX installations for all media: twisted pair, radio frequency, Ethernet/IP and power line.
To meet the latest technical and economic requirements and globalisation demands, KNX Association has now completely redesigned its Engineering Tool Software (ETS) including a set of many new functions. ETS4 makes it possible to implement KNX projects in a easy and fast way. Moreover, the use of the platform-independent universal standard XML makes it possible to access all KNX project related information in text form. The ETS4 is available from October 2010.
With the new ETS4, KNX Association has responded to new, tougher requirements in terms of handling, technical features, and economy – after all, the range of applications for which bus technology is used has recently tremendously increased. The average KNX installation has now also become quit larger. The functionality that non-residential buildings and intelligent residential buildings need to offer has also become more diverse.
KNX solutions need to handle current challenges like making buildings as energy-efficient as possible.
The demands from a technical and economic point of view for Electricians and system integrators designing, installing,
commissioning and supervising KNX systems, have increased.
Practical focus
It was essential that the new ETS4 would offer a clearly-structured, intuitive user interface meeting these increased demands. A new design for its user interface design was simply a top priority in its further development. A market leader from this sector was consulted in order to accomplish this requirement – which indicates the importance that KNX Association attaches to its device and manufacturer independent standard tool for home and building automation.
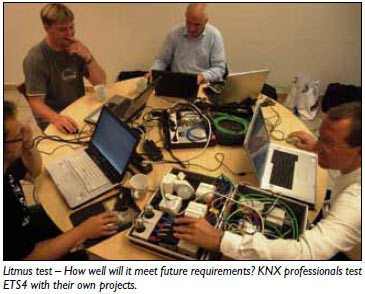
An international investigation was set up in order to optimise this new user interface, not only KNX professionals but also beginners with little or no KNX knowledge were consulted. System integrators with ETS3 expertise had the opportunity to try out the usefulness of the new features and at the same time the chance to give feedback based on their daily experience.
The tests with beginners were conducted to determine how intuitive the restructured work flows really are. In workshops held around the world, both professionals and beginners tested the tool on its daily usefulness in respect to maintaining projects quickly and offering highly demanding services.
The result of all of this research work is a stateof-the-art tool that meets the needs of a modern home and building control technology.
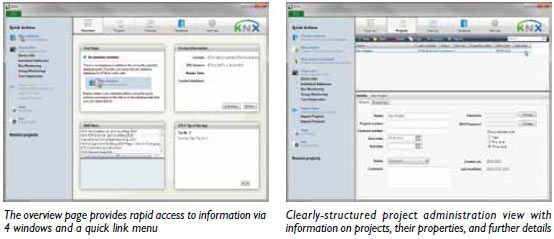
Highly visual interface
The tool’s new user interface is characterised by an up-todate, highly visual design. A new feature is for example an overview page, where users can view projects and access further information such as KNX news and the current ETS4 configuration. The project administration view, which shows project data and properties, is clearer than the ones from its predecessor.
The selective lists for opening databases, opening projects, importing data and viewing the most recently opened projects are together with the central toolbar, very useful features.
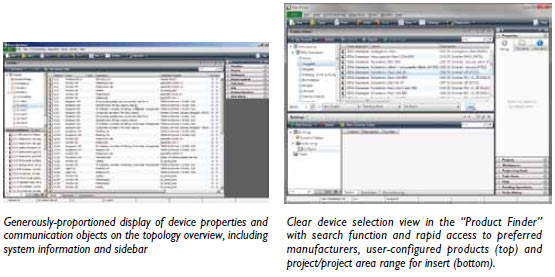
Initially ETS users – when working on projects – might miss the ‘old’ overview, because it’s no longer divided into three parts – topology view, group address view and building view. But professionals will quickly appreciate the simplified navigation and larger overviews of the “single window interface”. This is because of integrating various system views into one, crucial information is always visible and this without the need for additional menus.
In the topology overview for example, it only takes a mouse click via the line and device menu to quickly and easily reach communication objects, device details and comments. Important information can always be called via a sidebar. There is also a special Favourites window which can be personalised in order to quickly access customer-specific elements such as preconfigured devices or entire lines.
Intuitive
 Another advantage of the new ETS4 user interface is the “guided workflow” – a step by-step tutorial for creating bus configurations. Especially the topic-based Help features and the possibility to undo and repeat actions are very convenient.
System checks can be carried out at any time – this allows possible configuration errors to be detected quickly and in time. Drag & drop for e.g. assigning group addresses to communication objects, makes working with ETS4 yet even more intuitive. Thanks to the free-configurable views (dynamic folders), professionals can put together their own
interfaces in order to suit them to the way they work.
.
Related articles
- IEC 61850 Standard In Details (1)
- Benefits Of IEC 61850
- An Example Of KNX Project Design
- ABB i-bus KNX – Constant lighting control
3,943 views

Arc-resistant low voltage switchgear
For years, electrical equipment has been designed to withstand and deal with the issue of bolted faults, where the current spikes to a dangerously high level but is safely interrupted by the protective devices contained in the equipment (breakers, fuses and relays). However, these devices typically do not detect and interrupt dangerous internal arcing faults, which have a lower current level, but can generate a far more dangerous scenario for operating personnel.
Arc faults can be caused by a breakdown of insulation materials, objects coming into close proximity with the energized bus assembly, even entry of rodents or other animals into the equipment. The thermal energy created by these events can get as high as 35,000ºF, melting materials and clothing from several feet away. Also consider that the arc blast produced by a lineup of 480 Vac switchgear rated at 85 kA can be equivalent to 20.7 lbs of TNT!
.
So, what is the solution?
Eaton’s solution: arc-resistant low voltage switchgear
Eaton introduces the addition of an ANSI Type 2 arc-resistant low voltage switchgear offering to its current product line. This is the latest release in arc-safe equipment from Eaton’s Electrical Sector. The arc-resistant low voltage switchgear protects operating and maintenance personnel from dangerous arcing faults
by redirecting or channeling the arc energy out the top of the switchgear, regardless of the origination location of the arc.
Eaton’s arc-resistant low voltage switchgear has been successfully tested to ANSI C37.20.7 at KEMA-Powertest, and has been ULT witnessed and certified.
Standard features
- Ratings:
- Up to 100 kA short circuit at 508 Vac maximum and up to 85 kA short circuit at 635 Vac maximum
- Up to 10 kA horizontal main bus continuous current
- Up to 5 kA vertical bus continuous current
- MagnumE DS power circuit breaker frame ratings between 800A and 6000A
- ANSI Type 2 arc-resistant design protects the operator around the entire perimeter of the equipment
- Floor-to-ceiling height of 10 feet required whether exhausting into a room or through an arc plenum
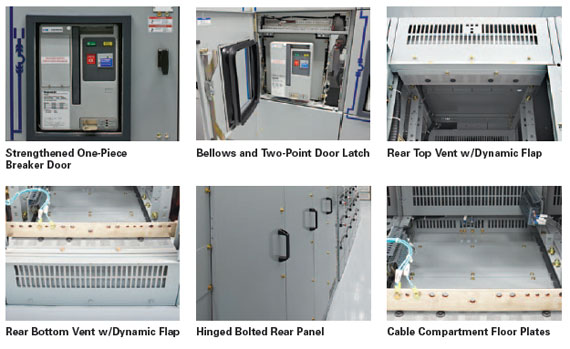
- Strengthened one-piece breaker door and latches
- Dynamic flap system on rear ventilation openings that remain open under normal operating conditions, but close during an arcing event to prevent dangerous gasses from escaping
- Patented bellows design allowing drawout of breaker into the disconnected position with the door closed, while simultaneously protecting the operator from any dangerous gasses during an arc event
- Patented venting system that directs arc gasses out the top of the enclosure, regardless of the arc origination location
- Up to four-high breaker configuration with no additional layout restrictions
- Strengthened side and rear panels with standard split rear covers for cable access
- NEMAT 1 enclosure, with either top or bottom cable or bus duct entry
- Cable compartment floor plates
Optional features
- Zone selective interlocking protection
- ANSI Type 2B arc-resistant design protects the operator even with the low voltage instrument compartment door open
- Arcflash Reduction Maintenance SystemE
- Safety shutters
- One-piece hinged and bolted rear panel
- Insulated bus
- Vented bus/cable compartment barrier
- Cable compartment segregation barrier
Benefits
- Superior protection against arcs in breaker, bus or cable compartments
- No increase in footprint over regular Magnum DS switchgear
- Closed door racking
Standards
- UL 1558 and UL 891
- ANSI C37.20.1, ANSI C37.13, ANSI C37.51 and ANSI C37.20.7
- CSAT standard—CSA C22.2 No. 31-04
- Third-party (UL/CSA) witness tested
- Seismic certification 2006-IBC
Testing
Testing procedures were completed per ANSI C37.20.7 standards with arcs initiated in:
- Breaker compartment
- Vertical and horizontal bus
- Cable termination compartments
Additionally, the tested arc duration was up to the full 0.5 seconds recommended by ANSI C37.20.7, with no dependence on the tripping speed of an upstream breaker.
.
Related articles
- Short Circuit Parameters in Low Voltage AC Circuits
- GE AKD-20 Low-Voltage Switchgear
- Siemens MV Topic – Loss Of Vacuum
- Short Circuit Current Calculator & Group Motor Protection
- Gas-Insulated Switchgear Type 8DN8
3,291 views

PowerLogic System lets you optimise the cost, quality and reliability of an electrical installation. It combines communicating devices with power monitoring software operating under Windows. PowerLogic System provides information on the entire electrical installation.
It offers a wide range of possibilities and can carry out a number of tasks including:
- alarm processing
- automatic tasks (e.g. automatic reports)
- precision instrumentation
- power quality and disturbance measurements
- data transfer
- etc.
PowerLogic System can be used for all electrical distribution systems. It creates a network of communicating devices connected to one or more supervision stations.
PowerLogic System is made up of three main parts:
- communicating devices
- communication interfaces
- SMS software.
The products listed below are part of the PowerLogic System:
- Circuit Monitor
- Power Meter
- low-voltage circuit breakers
- Digipact DC150 interfaces
- Sepam protection relays
- Vigilohm System
- and all third-party devices using the Modbus protocol (specific configuration is required).
8,781 views

Fig 1 - General layout of a hydropower plant
A hydroelectric plant converts the potential energy of water into electricity by the use of flowing water.
This water flows in water streams with different slopes giving rise to different potential for creating heads (size of fall), varying from river to river.
The capacity (power) of a plant depends on the head (change in level) and flow as a result of the hydrology in the catchment area of a river.
.
Medium and high head schemes:
This type of plant typically uses weirs to divert water to the intake. From there it is led to the turbines via a pressure pipe or penstock. An alternative to penstocks, which in many cases is more economic, relies on a canal with reduced gradient running alongside the river. The canal carries the water to the pressure intake, and then, in a short penstock, to the turbines.
Categories of heads of the streams:

Low head schemes:
This kind of project is appropriate to river valleys, particularly in the lower reaches. Either the water is diverted to a power intake with a short penstock, or the head is created by a small dam, complete with integrated intake, powerhouse and fish ladder.
What are the main types of hydro schemes?
There are three main categories of hydroschemes, as described bellow by IEC (International Electrotechnical Commission):
- Run-of-river hydro plants use the river flow as it occurs, the filling period of its reservoir being practically negligible. The majority of small hydropower plants are run-of-river plants because of the high construction cost of a reservoir.
- Pondage hydro plants are plants in which the reservoir permits the storage of water over a period of a few weeks at most. In particular, a pondage hydro plant permits water to be stored during periods of low load to enable the turbine to operate during periods of high load on the same or following days. Some small hydropower plants fall into this type, especially high head ones with high installed capacities (> 1.000 kW).
- Reservoir hydro plants are plants in which the filling period of the reservoir is longer than several weeks. It generally permits water to be stored during high water periods to enable the turbine to operate during later high load periods. As the operation of these plants requires the construction of very large basins, practically no small or micro hydropower plant is of this type.
What are the typical characteristics of small-sized hydro schemes?
- Micro hydropower plants up to 100 kW
- Mini hydropower plants up to 500 kW
- Small hydropower plants up to 10,000 kW*
Micro-hydro power schemes normally only support investment in large reservoirs if these are built for other purposes in addition to hydropower (e.g. water abstraction systems, flood control, irrigation networks, recreation areas). Nevertheless, there are ingenious solutions for linking and fitting the turbine in waterways designed for other purposes, e.g. schemes integrated with an irrigation canal or a water abstraction system.
Below are a few examples of several possible applications of small, mini and micro hydropower plants.
Schemes integrated with an irrigation canal
EXAMPLE-1 The canal is enlarged to the extent required to accommodate the intake, the power station, the tailrace and the lateral bypass. The scheme should include a lateral bypass to ensure an adequate water supply for irrigation, should the turbine be shut down. This kind of scheme should be designed at the same time as the canal, because the widening of the canal in full operation is an expensive option.
EXAMPLE-2 The canal is slightly enlarged to include the intake and spillway. To reduce the width of the intake to minimum, an elongated spillway should be installed. From the intake, a penstock running along the canal brings the water under pressure to the turbine. The water, once through the turbine, is returned to the river via a short tailrace. As fish are generally not present in canals, fish passes are usually unnecessary.
Schemes integrated in a water supply system
Drinking water is supplied to a city by conveying the water from a headwater reservoir via a pressure pipe. Usually in this type of installation, the dissipation of energy at the lower end of the pipe at the entrance to the Water Treatment Plant is achieved through the use of special valves. The fitting of a turbine at the end of the pipe, to convert this otherwise lost energy to electricity, is an attractive option, provided that waterhammer, which would endanger the pipe, is avoided.
Waterhammer overpressures are especially critical when the turbine is fitted on an old pressure pipe.
Micro hydropower plants at sluice systems
The installation of a small hydropower plant in a sluice system along large rivers can be an interesting multi-purpose use of existing structures dedicated to other purposes. The exploitation for hydroelectric purposes of the head created by a sluice system allows the production of energy by a renewable energy source without further significant environmental impacts. An interesting and recent example of this application is given by a pilot project where a 26 kW turbine unit of four parallel 6.5kW propeller turbines has been inserted in an old sluice constructed for agricultural purposes at Niemieryczow in Poland.
Micro hydropower plants on river stabilization ramps
This rather unusual application is very interesting from an environmental point of view. Ramps are often constructed to stabilize the river course, particularly on fast flowing mountain rivers. The artificial head created by the ramps or by a series of check dams can be exploited for hydroelectric production. Installed power is however generally small since the flows and heads are generally low. Nevertheless this application represents an opportunity to meet the twin objectives of river protection and the use of a renewable energy source for energy production at the same time.
Micro hydropower plants at bed load barriers
Bed load barriers create an artificial head in the watercourse which can be exploited for energy production.
.
How to choose a site from a technical point of view?
Apart from the environmental issues, which will be discussed in detail in later chapters, a MHPP should consider the following three main issues if it is to be economically feasible.
Relevant aspects for site evaluation:

What does the power of an MHPP depend on?
The amount of electricity generated is the result of the head and the flow rate at a specific site. The power generated also depends on the turbine generator efficiency and pressure losses at the intake and penstock. Moreover, other constraints, such as environmental issues and fisheries, may oblige the developer to leave a minimum flow in the watercourse. It should also not be forgotten that the available energy depends on the day-to-day and year-to-year variations of the flow. The impact of these variations could be very significant, so careful measurements should be made.
How to estimate the power availability in a site:

What parameters are used in selecting a hydro turbine?
Head, flow and power are the three main technical aspects in selecting a turbine. There are five main turbine types and each might be appropriate to certain physical conditions at each site.
Turbines can be grouped in two main categories:
Action turbines (or impulse turbines)
These only use the speed of the water, i.e. only use kinetic energy. This type of turbine is appropriate for high heads (75 meters to >1000 meters) and small flows.
The most popular such turbines are Pelton Wheels, which have a circular disc or runner with assembled vanes or double-hollow spoons. There are also other models like the Turgo side injection turbine, and the Ossberger or Banki Mitchell double propulsion turbines (these are further described in the text as “crossflow on Banki Mitchel turbine”).
Reaction turbines
This kind of turbine takes advantage of the water speed, and the pressure maintains the flow when contact takes place. The most frequently used are Francis and Kaplan turbines. Usually they have four basic elements: the casing or shell, a distributor, a pad, and the air intake tube.
There are two distinct groups: radial turbines (Francis type) are suitable for operating on sites with a medium head and flow and axial turbines (Kaplan and Propeller type) are appropriate for operation with low heads and high and low flows. Both action and reaction turbines may be used in MHPP.
What are the differences between the turbines?
Pelton turbine: is a typical high head turbine, which can also be used for medium heads, with power ranging from 5 kW to large sizes. This is an easy to use action-type turbine with a high efficiency curve and it has a good response to variations in flow.
Cross Flow or Banki Mitchell turbines: are mainly used at sites where there is low installed power. In general their overall efficiency (around 75-80%) is lower than conventional turbines. They have a good response to variations in flow, which makes them appropriate for work where there is a wide range of flows. They have the advantage of simplicity and ease of maintenance and repair. They are a tried and proven technology which can exploit sites that cannot otherwise be used economically and where, therefore, their limited efficiency is not relevant. They are suitable for low to high head sites from 1 m to 200 m head with flows over 100 l/s.
Francis Turbines: are single regulated turbines more appropriate to use with higher heads given their efficiency.
Propeller turbines: have the advantage of running at high speeds even at low heads. Kaplan Turbine are high efficiency propeller-type turbines, very advanced and consequently quite expensive in investment and maintenance. Their response to different ranges of flow conditions is very good.More is said about propeller turbines in the next chapter.
 Pelton turbine |  Cross Flow or Banki Mitchell turbines |
 Francis Turbines | ") Propeller turbines (Kaplan Turbine) |
SOURCE: GUIDE LINES FOR MICRO HYDROPOWER DEVELOPMENT – European Commission
.
Related articles
- Hydropower In Details
- Hydropower – Systems Overview (2)
- Hydropower – Systems Overview (1)
- Wind Power Applications
- The Unique Role Of Wind Turbine Step-Up (WTSU) Transformers
31,138 views

Substation, Its Function And Types
An electrical sub-station is an assemblage of electrical components including busbars, switchgear, power transformers, auxiliaries etc.
These components are connected in a definite sequence such that a circuit can be switched off during normal operation by manual command and also automatically during abnormal conditions such as short-circuit. Basically an electrical substation consists of No. of incoming circuits and outgoing circuits connected to a common Bus-bar systems. A substation receives electrical power from generating station via incoming transmission lines and delivers elect. power via the outgoing transmission lines.
Sub-station are integral parts of a power system and form important links between the generating station, transmission systems, distribution systems and the load points.
MAIN TASKS
…Associated with major sub-stations in the transmission and distribution system include the following:
- Protection of transmission system.
- Controlling the Exchange of Energy.
- Ensure steady State & Transient stability.
- Load shedding and prevention of loss of synchronism. Maintaining the system frequency within targeted limits.
- Voltage Control; reducing the reactive power flow by compensation of reactive power, tap-changing.
- Securing the supply by proving adequate line capacity.
- Data transmission via power line carrier for the purpose of network monitoring; control and protection.
- Fault analysis and pin-pointing the cause and subsequent improvement in that area of field.
- Determining the energy transfer through transmission lines.
- Reliable supply by feeding the network at various points.
- Establishment of economic load distribution and several associated functions.
TYPES OF SUBSTATION
The substations can be classified in several ways including the following :
- Classification based on voltage levels, e.g. : A.C. Substation : EHV, HV, MV, LV; HVDC Substation.
- Classification based on Outdoor or Indoor : Outdor substation is under open skv. Indoor substation is inside a building.
- Classification based on configuration, e.g. :
- Conventional air insulated outdoor substation or
- SF6 Gas Insulated Substation (GIS)
- Composite substations having combination of the above two
- Classification based on application
- Step Up Substation : Associated with generating station as the generating voltage is low.
- Primary Grid Substation : Created at suitable load centre along Primary transmission lines.
- Secondary Substation : Along Secondary Transmission Line.
- Distribution Substation : Created where the transmission line voltage is Step Down to supply voltage.
- Bulk supply and industrial substation : Similar to distribution sub-station but created separately for each consumer.
- Mining Substation : Needs special design consideration because of extra precaution for safety needed in the operation of electric supply.
- Mobile Substation : Temporary requirement.
NOTE : - Primary Substations receive power from EHV lines at 400KV, 220KV, 132KV and transform the voltage to 66KV, 33KV or 22KV (22KV is uncommon) to suit the local requirements in respect of both load and distance of ultimate consumers. These are also referred to ‘EHV’ Substations.
- Secondary Substations receive power at 66/33KV which is stepped down usually to 11KV.
- Distribution Substations receive power at 11KV, 6.6 KV and step down to a volt suitable for LV distribution purposes, normally at 415 volts
SUBSTATION PARTS AND EQUIPMENTS
Each sub-station has the following parts and equipment.
- Outdoor Switchyard
- Incoming Lines
- Outgoing Lines
- Bus bar
- Transformers
- Bus post insulator & string insulators
- Substation Equipment such as Circuit-beakers, Isolators, Earthing Switches, Surge Arresters, CTs, VTs, Neutral Grounding equipment.
- Station Earthing system comprising ground mat, risers, auxiliary mat, earthing strips, earthing spikes & earth electrodes.
- Overhead earthwire shielding against lightening strokes.
- Galvanised steel structures for towers, gantries, equipment supports.
- PLCC equipment including line trap, tuning unit, coupling capacitor, etc.
- Power cables
- Control cables for protection and control
- Roads, Railway track, cable trenches
- Station illumination system
- Main Office Building
- Administrative building
- Conference room etc.
- 6/10/11/20/35 KV Switchgear, LV
- Indoor Switchgear
- Switchgear and Control Panel Building
- Low voltage a.c. Switchgear
- Control Panels, Protection Panels
- Battery Room and D.C. Distribution System
- D.C. Battery system and charging equipment
- D.C. distribution system
- Mechanical, Electrical and Other Auxiliaries
- Fire fighting system
- D.G. Set
- Oil purification system
An important function performed by a substation is switching, which is the connecting and disconnecting of transmission lines or other components to and from the system. Switching events may be “planned” or “unplanned”. A transmission line or other component may need to be deenergized for maintenance or for new construction; for example, adding or removing a transmission line or a transformer. To maintain reliability of supply, no company ever brings down its whole system for maintenance. All work to be performed, from routine testing to adding entirely new substations, must be done while keeping the whole system running.
Perhaps more importantly, a fault may develop in a transmission line or any other component. Some examples of this: a line is hit by lightning and develops an arc, or a tower is blown down by a high wind. The function of the substation is to isolate the faulted portion of the system in the shortest possible time.
There are two main reasons: a fault tends to cause equipment damage; and it tends to destabilize the whole system. For example, a transmission line left in a faulted condition will eventually burn down, and similarly, a transformer left in a faulted condition will eventually blow up. While these are happening, the power drain makes the system more unstable. Disconnecting the faulted component, quickly, tends to minimize both of these problems.
.
Related articles
- Gas-Insulated Switchgear Type 8DN8
- ABB launches new generation 420kV gas insulated switchgear
- What is PowerLogic System?
- History Of The Power Substations
- Transformer heating and cooling
23,785 views

ABB - General about motors
Modern electrical motors are available in many different forms, such as single phase motors, three-phase motors, brake motors, synchronous motors, asynchronous motors, special customised motors, two speed motors, three speed motors, and so on, all with their own performance and characteristics.
For each type of motor there are many different mounting arrangements, for example foot mounting, flange mounting or combined foot and flange mounting. The cooling method can also differ very much, from the simplest motor with free self-circulation of air to a more complex motor with totally enclosed air-water cooling with an interchangeable cassette type of cooler.
To ensure a long lifetime for the motor it is important to keep it with the correct degree of protection when under heavy-duty conditions in a servere environment. The two letters IP (International Protection) state the degree of protection followed by two digits, the first of which indicates the degree of protection against contact and penetration of solid objects, whereas the second states the motor’s degree of protection against water.
The end of the motor is defined in the IEC-standard as follows:
- The D-end is normally the drive end of the motor.
- The N-end is normally the non-drive end of the motor.
Note that in this handbook we will focus on asynchronous motors only.
Squirrel cage motors
In this chapter the focus has been placed on the squirrel cage motor, the most common type of motor on the market. It is relatively cheap and the maintenance cost is normally low.
There are many different manufacturers represented on the market, selling at various prices. Not all motors have the same performance and quality as for example motors from ABB. High efficiency enables significant savings in energy costs during the motor’s normal endurance. The low level of noise is something else that is of interest today, as is the ability to withstand severe environments.
 There are also other parameters that differ. The design of the rotor affects the starting current and torque and the variation can be really large between different manufacturers for the same power rating. When using a softstarter it is good if the motor has a high starting torque at Direct-on-line (D.O.L) start. When these motors are used together with a softstarter it is possible to reduce the starting current further when compared to motors with low starting torque. The number of poles also affects the technical data. A motor with two poles often has a lower starting torque than motors with four or more poles.
Voltage
Three-phase single speed motors can normally be connected for two different voltage levels. The three stator windings are connected in star (Y) or delta (D). The windings can also be connected in series or parallel, Y or YY for instance. If the rating plate on a squirrel cage motor indicates voltages for both the star and delta connection, it is possible to use the motor for both 230 V, and 400 V as an example.
The winding is delta connected at 230 V and if the main voltage is 400 V, the Y-connection is used. When changing the main voltage it is important to remember that for the same power rating the rated motor current will change depending on the voltage level. The method for connecting the motor to the terminal blocks for star or delta connection is shown in the picture below.

Power factor
A motor always consumes active power, which it converts into mechanical action. Reactive power is also required for the magnetisation of the motor but it doesn’t perform any action. In the diagram below the active and reactive power is represented by P and Q, which together give the power S.
 The ratio between the active power (kW) and the reactive power (kVA) is known as the power factor, and is often designated as the cos φ. A normal value is between 0.7 and 0.9, when running where the lower value is for small motors and the higher for large ones.
Speed
The speed of an AC motor depends on two things: the number of poles of the stator winding and the main frequency. At 50 Hz, a motor will run at a speed related to a constant of 6000 divided by the number of poles and for a 60 Hz motor the constant is 7200 rpm.
To calculate the speed of a motor, the following formula can be used:
![]()
n = speed
f = net frequency
p = number of poles
Example:
4-pole motor running at 50 Hz
![]()
This speed is the synchronous speed and a squirrel-cage or a slip-ring motor can never reach it. At unloaded condition the speed will be very close to synchronous speed and will then drop when the motor is loaded.
 The difference between the synchronous and asynchronous speed also named rated speed is ”the slip” and it is possible to calculate this by using the following formula:
![]()
s = slip (a normal value is between 1 and 3 %)
n1 = synchronous speed
n = asynchronous speed (rated speed)
Table for synchronous speed at different number of poles and frequency:

Torque
The starting torque for a motor differs significantly depending on the size of the motor. A small motor, e.g. ≤ 30 kW, normally has a value of between 2.5 and 3 times the rated torque, and for a medium size motor, say up to 250 kW, a typical value is between 2 to 2.5 times the rated torque. Really big motors have a tendency to have a very low starting torque, sometimes even lower than the rated torque. It is not possible to start such a motor fully loaded not even at D.O.L start.
The rated torque of a motor can be calculated using the following formula:
![]()
Mr = Rated torque (Nm)
Pr = Rated motor power (kW)
nr = Rated motor speed (rpm)
 Slip-ring motors
In some cases when a D.O.L start is not permitted due to the high starting current, or when starting with a star-delta starter will give too low starting torque, a slip-ring motor is used. The motor is started by changing the rotor resistance and when speeding up the resistance is gradually removed until the rated speed is achieved and the motor is working at the equivalent rate of a standard squirrel-cage motor.

In general, if a softstarter is going to be used for this application you also need to replace the motor.
The advantage of a slip-ring motor is that the starting current will be lower and it is possible to adjust the starting torque up to the maximum torque.
SOURCE: ABB – SOFTSTARTER HANDBOOK
.
Related articles
- Cost benefits of AC drives
- The Benefits of VFDs In HVAC Systems
- The Power Factor
- PLC-Based Monitoring Control System for Three-Phase Induction Motors Fed by PWM Inverter
- Reduction In The Cost Of Electricity

Current Switching with High Voltage Air Disconnector
In the paper are presented results of switching overvoltages investigations, produced by operations of air disconnector rated voltage 220 kV. Measurements of these switching overvoltages are performed in the air-insulated substation HPP Grabovica on River Neretva, which is an important object for operation of electric power system of Bosnia and Herzegovina.
Investigations of operating of air disconnector type Centre-Break were performed in order to determine switching overvoltage levels that can lead to relay tripping in HPP Grabovica. During operations of disconnector (synchronization or disconnecting of generator from network) malfunctions of signalling devices and burning of supply units of protection relays were appeared. Also, results of computer simulations using EMTP-ATP [1] are presented.
I. INTRODUCTION
Switching operation in power stations and substations, highvoltage faults and lightning cause high levels of high frequency overvoltages that can be coupled with low voltage secondary circuits and electronic equipment unless they are suitably protected. The function of high-voltage air-break disconnectors is to provide electrical isolation of one part of the switchgear.
Disconnector’s standards define a negligible current interrupting capability (≤0.5 A) or a voltage between the contacts if it is not significantly changed. These values of currents include the capacitive charging currents of bushing, bus bars, connectors, very short lengths of cables and the current of voltage instrument transformers. Disconnector’s contacts in air-insulated substations (AIS) are moving slowly causing numerous strikes and restrikes between contacts.
When the contacts are closed, the capacitive charging current flowing through the contacts ranges from 0.017×10⁻³ to 1.1×10⁻³ A/m for voltage levels 72.5 – 500 kV [2], depending on the rated voltage and length of bus, which is switched.
Strikes and restrikes occur as soon as the dielectric strength of the air between contacts is exceeded by overvoltage. The distance between contacts, the contacts geometry and relative atmospheric condition defines the overvoltage at the instant of strike. Every strike causes high-frequency currents tending to equalize potentials at the contacts. When the current is interrupted, the voltages at the source side and the loading side will oscillate independently. The source side will follow the power frequency while the loading side will remain at the trapped voltage. As soon as the voltage between contacts exceeds the dielectric strength of the air, at that distance the restrike will occur, and so on. Successive strikes occurring during the closing and opening operations of the off-loaded bus by the disconnector are shown in Fig. 1 a and b, respectively.
When closing takes place, the first strike will occur at the maximum value of the source voltage. Its values can be positive or negative. As the time passes a series of successive strikes will keep occurring at reduced amplitude, until the contacts touch. The highest transient overvoltage therefore occurs during the initial pre-arc, Fig.1 a. When the disconnector opening, restrikes occur because of the very small initial clearance between the contacts. At the transient beginning, the intervals between particular strikes are on the order of a millisecond, while just before the last strike; the period can reach about one half of cycle at power frequency, Fig. 1 b.
 Disconnector closing, b) Disconnector opening 1-source side voltage, 2- load side voltage")
Fig. 1. The voltage due to the disconnector switching a) Disconnector closing, b) Disconnector opening 1-source side voltage, 2- load side voltage
During the switching time of operations of disconnectors at HPP Grabovica up to 500 restrikes were registered. In paper [3] there are up to 5000 restrike registered during switching operation of the disconnector. The maximum value of voltages and maximum value of the wave front increasing will take place at the maximum distance between contacts. For the purpose of the investigation of the insulation strength and induction of electromagnetic interferences (EMI), the most important are the first few strikes during the closing operation or the last few strikes during the opening operation. Each individual strike causes a travelling wave with the basic frequency on the order 0.5 MHz (330 kHz-600 kHz). Very fast transient overvoltage due to the closing operation of the disconnector at the load side of the test circuit is shown in Fig.2.

Fig. 2. Very fast transient overvoltage due to the closing operation Channel 1- source side voltage Channel 2-load side voltage
These high-frequency phenomena are coupled with the secondary circuits as a result of various mechanisms. The strongest interference is exerted by the stray capacities between the high-voltage conductors and the grounding system, followed by the metallic link between the grounding system and the secondary circuits.
High-frequency transient current flowing in the grounding system generates potential differences, every time when a strike occurs between disconnector’s contacts. In large secondary circuits, the potential differences are in the form of longitudinal voltages between the equipment inputs and the equipment enclosures.
Depending on the type of secondary circuits used and the way they are laid, differential voltages may also occur. Such a coupling mechanism has a special effect on the secondary circuits of instrument transformers, and particularly on the connected instruments, since these circuits are always galvanically linked to the grounding system. Another factor, which cannot be discounted, is the linking of these circuits to the primary plant via the internal capacities of the instrument transformers [4].
Interference levels in secondary circuits of air-insulated substations during switching disconnectors depend on following parameters:
- The transient voltages and currents generated by the switching operation;
- The voltage level of the substation;
- The relative position of the source of disturbances and susceptor;
- The nature of the grounding network;
- The cable type (shielded or unshielded);
- The way the shields are grounded.
There are two main modes of coupling secondary circuits with primary circuits [3, 5]:
- Electromagnetic or EM coupling, which can be split into three sub-categories; inductive, capacitive and radiative. The most important source of EM coupling is the propagating current and voltage waves on bus bars and power lines during high-voltage switching operations by disconnectors;
- Common impedance coupling, as a result of coupling caused by the sharing of a lumped impedance common to both the source and susceptor circuits.
Common mode voltages, i.e., voltages measured between conductors and local ground, represent the main parameter used for assessing equipment immunity. The difficulty of comparing data comes from the fact that different authors performed measurements at different places (some measurements were made at the closest point to the disconnector being operated whereas others made measurements in the vicinity of the auxiliary equipment, i.e. in the relay room). Little information is available about the grounding practice of the neutral conductor in CT or VT circuits, the quality and grounding of the sable shields as well as how the measurements have been performed. Therefore, the measured levels have to be analyzed very carefully before comparison and drawing any conclusions [5]. Results of up to date measured common mode voltages at secondary circuits of CVT, CT and VT are presented in the paper [5]. There are maximum levels of the common mode voltages ranging from 100 Vpeak up to 2.5 kVpeak in the shields of the secondary circuits cables of the CT and VT. Results show that measured values of the common mode voltages at CT/CV secondary circuits, 220 kV ratings, range from Ucm=0.32 kVpeak [6] up to Ucm=0.85 kVpeak [7].
Results shown in paper [3] are for measured common mode voltages from 3-4 kV during switching operation by disconnector in 150 kV switchgear up to 6-10 kV at 400 kV switchgear.
II. RESULTS OF EXPERIMENTAL MEASUREMENTS ON SITE
The last ten years of extensive analysis of disconnector and circuit breakers generated EMI measurements that have confirmed that disconnector operation with off-loaded busbar is the most important and typical source of interference in secondary circuits of substations. Measurements of switching overvoltages generated during disconnector operation in the air insulated substation HPP Grabovica on the river Neretva were performed. HPP Grabovica is an important object for operating of electric power system of Bosnia and Herzegovina. Investigations of operating of air disconnector type Centre-Break were performed in order to determine switching overvoltage levels that can lead to relay tripping in HPP Grabovica [8].
During operations of disconnector (synchronization or disconnecting of generator from network) malfunctions of signalling devices and burning of supply units of protection relays were appeared. Malfunctioning of auxiliary circuits were manifested by tripping relay of differential protection of the generator, phase ’4′- signalization on relay box ‘ZB I‘ and signalling ‘fire’ in 35 kV control panel.
At the same time sparking between primary terminals of the current transformer (CT) was occurred. Malfunctioning of
signalling circuits were lower (not eliminated) with installing shielded cables. Also, independent of switching operation of air insulated disconnectors, during synchronization of generator AG1 on network, it’s happened that one of the pole of 220 kV circuit breaker failures. In this case generator AG1 worked in motor regime. Because of that, HPP Grabovica plans to install circuit breakers on generator’s voltage (10,5 kV) [9].
The field tests were performed at the test circuit at HPP Grabovica, Fig. 3.
, CT-current transformer (200/1/1 A), CVD-capacitive voltage divider, CB-circuit breaker with two interrupting chambers and parallel capacitors (SF6 220 kV, 1600 A), Dc- disconnector (220 kV, 1250 A), MOSA-metal oxide surge arrester (Ur=199,5 kV, 10 kA), PT-power transformer (64 MVA, 242/10,5±5% kV, YD5), AG1- generator 1 (64 MVA, 10,5±5% kV)")
Fig. 3. The considered test circuit VT-voltage transformer (220/√3/0.1/√3/0.1/√3 kV), CT-current transformer (200/1/1 A), CVD-capacitive voltage divider, CB-circuit breaker with two interrupting chambers and parallel capacitors (SF6 220 kV, 1600 A), Dc- disconnector (220 kV, 1250 A), MOSA-metal oxide surge arrester (Ur=199,5 kV, 10 kA), PT-power transformer (64 MVA, 242/10,5±5% kV, YD5), AG1- generator 1 (64 MVA, 10,5±5% kV)
The recorded wave shape of the overvoltage at the load side is shown in Fig. 4. The overvoltage factors at busbar, k, were recorded up to 1.16 p.u. with the dominant frequency of considered transient fd equal to 0.536 MHz. Common mode voltages, Ucm, at VT were up to 708 Vpeak, with dominant frequency equal to 1.31 MHz.
, probe 1x100, ratio 455 Channel 2-voltages at secondary of VT; ch 2 (5 V/div), probe 1x100")
Fig. 4. Waveshape of the overvoltage Channel 1-voltage at CVD; ch 1 (2.5 V/div), probe 1x100, ratio 455 Channel 2-voltages at secondary of VT; ch 2 (5 V/div), probe 1x100
III. MODELING OF THE TEST CIRCUIT
Computer simulations were performed on the model of test circuit containing elements drawn in Fig. 5. Overvoltages at busbars were calculated during disconnector closing operations, for the same substation layout on which measurements were carried out.
, Ccb=100 pF; CT-500 pF; MOSA-100 pF; connection wire Z=440 Ω; PT-3.5 nF")
Fig. 5. Model of the test circuit Arc-4 Ω; stray-200 pF; connection tube Z=370 Ω; CVD-R=300 Ω, C=1 nF; VT-500 pF; CB-2 capacitors, each C≅2 nF, (capacitance of open contacts, each C≅20 pF), Ccb=100 pF; CT-500 pF; MOSA-100 pF; connection wire Z=440 Ω; PT-3.5 nF
The waveshape of simulated overvoltage surge at load side is given in Fig. 6. The difference between magnitudes of measured and simulated overvoltages is 5 %. The dominant frequency of simulated overvoltage is 0.620 MHz. Comparison between results of measured and calculated overvoltages certified a good agreement of obtained values.

Fig. 6. Waveshape of simulated overvoltage surge
When the Capacitive Voltage Divider (CVD) was excluded, there were higher values of calculated overvoltages (15% higher on amplitude and 6 % on frequency). Capacitive divider due to primary resistor equal to 300 W and primary capacitance equal to 1 nF influences on overvoltage at the same measurement point causing attenuation and damping of transient overvoltrages. In order to reduce EMI in secondary circuits the best way is to reduce sources of interference emission during switching of air insulated disconnector.
One of the ways of reducing is to install disconnecting circuit breakers. Substation disconnectors isolate circuit breakers from rest of the system during maintenance and repair. The maintenance requirements for modern SF6 high voltage circuit breakers are lower than maintenance demands made on disconnectors, which means one of reasons for disconnectors removed. Installing disconnecting circuit breaker there are no needs for switching operation of disconnectors. With disconnecting circuit breakers it is still possible to isolate the line, but low maintenance requirements means it is no longer necessary to isolate the circuit breaker. The disconnecting breaker had to be designed to safety lock in the open position, and to meet all voltage withstanding capabilities and safety requirements of disconnectors.
Another way of reducing sources of interference emission is to install circuit breaker without parallel capacitors to contacts. This suggestion is based on analyses performed on three circuit models:
- Model of CB with two breaking chambers and paralel capacitors and VT on netvork side of CB;
- Model of CB with two breaking chambers and without paralel capacitors and VT on netvork side of CB
- Model of CB with two breaking chambers and without paralel capacitors and VT on generator side of CB
Magnitudes of simulated overvoltages are presented in Table I. Voltages are measured in point of connection of VT, CT and PT.

TABLE I - MAGNITUDES OF SIMULATED OVERVOLTAGES
Overvoltages on generator side of 220 kV CB during switching of disconnectors could be up to 320 V in the case of installing instrument voltage transformer (VT) on generator side of CB without parallel capacitors (near instrument current transformer CT). This case causes installing of circuit breaker at generator’s voltage (10,5 kV) for synchronization of generator to network (better conditions for synchronization). This solution of installing circuit breakers on generator’s voltage resulted from problems have occurred during synchronization of generatror with current 220 kV CB.
IV. CONCLUSION
Switching overvoltages due to disconnector operations have been analysed on the existing 220 kV AIS on HPP Grabovica. Measurements and calculations were conducted on the characteristic points in AIS, in order to determine the level of the EMI.
The result of measurements has shown that high frequency voltages on busbars occur with amplitudes up to 1.16 p.u. (233 kVpeak) and the dominant frequencies up to 0.6 MHz. The difference between magnitudes of measured and calculated overvoltages is 5 % and 15.6 % on frequency. Measured common mode voltages at secondary circuits were from 430 V up to 708 V. CVD influences on overvoltages at the same measurement point on busbars causing attenuation and damping of transient overvoltages.
Comparison of the transient computer simulations with field measurements showed that calculations could be used for
assessment of the transient overvoltages due to disconnector switching. In order to reduce EMI in secondary circuits, it is suggested to install switching modules and disconnecting circuit breakers [10] or to install circuit breakers without parallel capacitors to contacts.
AUTHORS: Salih Carsimamovic, Zijad Bajramovic, Miroslav Ljevak, Meludin Veledar, Nijaz Halilhodzic
.
Related articles
- Maintenance Of Molded Case Circuit Breakers (MCCB)
- Air Insulated Substations – Bus/Switching Configurations
- ABB launches new generation 420kV gas insulated switchgear
- History Of The Power Substations
- High Voltage Substation Earth Grid Impedance Testing
8,261 views

Shielding Of Power Cables
Shielding of an electric power cable is accomplished by surrounding the assembly or insulation with a grounded, conducting medium.
This confines the dielectric field to the inside of this shield.
Two distinct types of shields are used:
- Metallic
- Nonmetallic
.
.
The purposes of the insulation shield are to:
- Obtain symmetrical radial stress distribution withh the insulation.
- Eliminate tangential and longitudinal stresses on the surface of the insulation.
- Exclude from the dielectric field those materials such as braids, tapes, and fillers that are not intended as insulation.
- Protect the cables from induced or direct aver-voltages. Shields do this by making the surge impedance uniform along the length of the cable and by helping to attenuate surge potentials.
Conductor Shielding
In cables rated over 2,000 volts, a conductor shield is required by indusby standards. The purpose of the semiconducting, also called screening, material over the conductor is to provide a smooth cylinder rather than the relatively rough surface of a stranded conductor in order to reduce the stress concentration at the interface with the insulation. Conductor shielding has been used for cables with both laminar and extruded insulations. The materials used are either semiconducting materials or ones that have a high dielectric constant and are known as stress control materials. Both serve the same function of stress reduction.
Conductor shields for paper insulated cables are either carbon black tapes or metallized paper tapes. The conductor shieldmg materials were originally made of semiconducting tapes that were helically wrapped over the conductor. Present standards still permit such a tape over the conductor. This is done, especially on large conductors, in order to hold the strands together firmly during the application of the extruded semiconducting material that is now required for medium voltage cables. Experience with cables that only had a semiconductingtape was not satisfactory, so the industry changed their requirements to call for an extruded layer over the conductor.
In extruded cables, this layer is now extruded directly over the conductor and is bonded to the insulation layer that is applied over this stress relief layer. It is extremely important that there be no voids or extraneous material between those two layers.
Presentday extruded layers are not only clean (free from undesirable impurities) but are very smooth and round. This has greatly reduced the formation of water tress that could originate from irregular surfaces. By extruding the two layers at the same time, the conductor shield and the insulation are cured at the same time. This provides the inseparable bond that minimizes the chances of the formation of a void at the critical interface. For compatibility reasons, the extruded shielding layer is usually made from the same or a similar polymer as the insulation. Special carbon black is used to make the layer over the conductor semiconducting to provide the necessary conductivity. Industry standards require that the conductor semiconducting material have a maximum resistivity of 1,000 meter-ohms. Those standards also require that this material pass a long-time stability test for resistivity at the emergency operating temperature level to insure that the layer remains conductive and hence provides a long cable life.
A water-impervious material can be incorporated as part of the conductor shield to prevent radial moisture transmission. This layer consists of a thin layer of aluminum or lead sandwiched between semiconducting material. A similar laminate may be used for an insulation shield for the same reason.
There is no definitive standard that describes the class of extrudable shielding materials known as “super smooth, super clean”. It is not usually practical to use a manufacturer’strade name or product number to describeany material. The term “super smooth, super clean” is the only way at this writing to describe a class of material that provides a higher quality cable thanan earlier version. This is only an academic issue since the older type of materials are no longer used for medium voltage cable construction by known suppliers. The point is that these newer materials have tremendously improved cable performance in laboratory evaluations.
Insulation Shielding For Medium-Voltage Cables
The insulation shield for a medium voltage cable is made up of two components:
- Semiconducting or stress relief layer
- Metallic layer of tape or tap , drain wires, concentric neutral wires, or a metal tube.
They must function as a unit for a cable to achieve a long service life
Stress Relief Layer
The polymer layer used with exbuded cables has replaced the tapes shields that were used many years ago. This extruded layer is called the extruded insulation shield or screen. Its properties and compatibility requirements are similar to the conductor shield previously described except that standards require that the volume resistivity of thisexternal layer be limited to 500 meter-ohms.
The nonmetallic layer is directly Over the insulation and the voltage stress at that interface is lower than at the conductor shield interface.. This outer layer is not required to be bonded for cables rated up to 35 kV. At voltages above that, it is strongly recommendedt that this layer be bonded to the insulation .
Since most users want this layer to be easily removable, the Association of Edison Illuminating Companies (AEIC) has established strip tension limits. Presently these limits are that a 1/2 inch wide strip cut parallel to the conductor peel offwith a minimum of 6 pounds and a minimum of 24 pounds of force that is at a 90º angle to the insulation surface.
Metallic Shield
The metallic portion of the insulation shield or screen is necessary to provide a low resistance path for charging current to flow to ground. It is important to realize that the extruded shield materials will not survive a sustained current flow of more than a few milliamperes. These materials are capable of handing the small amounts of charging current, but cannot tolerate unbalanced or fault currents.
The metallic component of the insulation shield system must be able to accommodate these higher currents. On the other hand, an excessive amount of metal in the shield of a single-conductor cable is costly in two ways. First, additional metal over the amount that is actually required increases the initial cost of the cable. Secondly, the greater the metal component of the insulation shield, the higher the shield losses that result h m the flow of current in the central conductor.
A sufficient amount of metal must be provided in the cable design to ensure that the cable will activate the back-up protection in the event of any cable fault over the life of that cable. There is also the concern for shield losses.
It therefore becomes essential that:
- The type of circuitinterruptingequipmentto be analyzed.What is the design and operational setting of the hse, recloser, or circuit breaker?
- What fault current will the cable encounter over its life?
- What shield losses can be tolerated? How many times is the shield to be grounded? Will there be shield breaks to prevent circulating currents?
Concentric Neutral Cables
When concentric neutral cables are specified, the concentric neutrals must be manufactured in accordance with ICEA standards. These wires must meet ASTM B3 for uncoated wires or B33 for coated wires. These wires are applied directly over the nonmetallic insulation shield with a lay of not less than six or more than ten times the diameter over the concentric wires.
Shielding Of Low Voltage Cables
Shielding of low voltage cables is generally required where inductive interference can be a problem. In numerous communication, instrumentation, and control cable applications, small electrical signals may be transmitted on the cable conductor and amplified at the receiving end. Unwanted signals (noise) due to inductive interference can beaslargeasthedesiredsignal. This can result in false signals or audible noise that can effect voice communications.
Across the entire frequency spectrum, it is necessary to separate disturbances into electric field ef€ects and magnetic field effects.
Electric Fields
Electric field effects are those which are a function of the capacitive coupling or mutual capacitance between the circuits. Shielding can be effected by a continuous metal shield to isolate the disturbed circuit fiom the disturbing circuit. Even semiconducting extrusions or tapes supplemented by a grounded dmin wirecan serve some shielding function for electric field effects.
Magnetic Fields
Magnetic field effects are the result of a magnetic field coupling between circuits. This is a bit more complex thanfor electrical effects.
At relatively low frequencies, the energy emitted from the source is treated as radiation. This increases with the square of the frequency. This electromagnetic radiation can cause dislxrbancesat considerable distance and will penetrate any “openings” in the shielding. This can occur with braid shields or tapes that are not overlapped. The type of metal used in the shield also can effect the amount of disturbance. Any metallic shield material, as opposed to magnetic metals, will provide some shield due to the eddy currents that are set up in the metallic shield by the impinging field. These eddy currents tend to neutralize the disturbing field. Non-metallic, semiconducting shielding is not effective for magnetic effects. In general, the most effective shielding is a complete steel conduit, but thisis not always practical.
The effectiveness of a shield is called the “shielding factor” and is given as:
SF = Induced voltage in shield circuit / Inducted voltage in unshielded circuit
Test circuits to measwe the effectiveness of various shielding designs against electrical field effects and magnetic field effects have been reported by Gooding and Slade.
AUTHORS: Lawrence J. Kelly and Carl C. Landinger
.
Related articles
- Dry-Type disc wound transformers in MV applications
- Grounded or Ungrounded Systems
- Ispitivanje i održavanje energetskih transformatora
- UPS design criteria and selection
- Arc-resistant low voltage switchgear
5,185 views

Figure 1: Three generations of transformer substations
Early transformers were located at the top of pylons and could achieve powers of up to 1000kVA. Column-type transformer substations provided the interface between overhead and underground networks. These were equipped essentially with air-insulated MV switchgear, a liquid- insulated transformer and a low voltage distribution switchboard.
These were fabricated from bricks, and thanks to the chimney effect provided by the column the substations had good airflow, and consequently there were no problems with overheating of the equipment.
However the next generation of substations for underground networks also built from brick, had a reduced height and no chimney effect, and for the first time the equipment designers had to confront overheating problems.
This second generation of transformer substations was also the subject of the first internal fault tests, intended to provide operating personnel and the general public with greater levels of safety. The next step was the introduction of factory assembled prefabricated transformer substations.

Figure 2: 630kVA qualified by EDF, validated against internal faults in the air and easily integrated into buildings.
This third generation of transformer substations were subject to the first international regulations. These substations were characterised by the use of more compact, environmentally insensitive equipment, factory assembled and standardised which means that Utilities can be supplied with series produced products, the production and performance of which are guaranteed by the tests carried out by the manufacturers in accredited laboratories.
For the third generation substations the first Utility specifications demanded small surface areas, leading to a standardised layout of the substations (Figure 1).
This enclosure can be metallic, GRC (Glass Reinforced Concrete), GRP (Glass Reinforced Plastic), SFRC (Steel Fibres Reinforced Concrete). The world wide trend is for reinforced concrete enclosures for the following reasons :
- Improved mechanical strength
- Reduced effect of solar radiation
- Reduced condensation
- Improved fire behaviour
- Weathering
- Improved aesthetic.
Finally, a fourth generation of transformer substations (Figure 2) has recently appeared, where the detailed technical specification has been replaced by functional specification.
AUTHORS: Thierry CORMENIER, ALSTOM-France; Robert DIDES.
.
Related articles
- Substation, Its Function And Types
- Superconducting transformers
- UPS design criteria and selection
- What is PowerLogic System?
- Current Switching with High Voltage Air Disconnector
2,931 views
")
Corona ions (air ionisation)
The intense electric field on the surface of powerline cables is sufficient to ionise the air, producing corona ions. This process is the cause of the characteristic buzzing or crackling of powerlines. Corona ions are routinely emitted from high voltage powerlines, especially in wet conditions. Corona ion effects have been measured up to 7 kilometres from powerlines both in the UK and in Germany. Corona ions are small electrically-charged particles which, when emitted from powerlines attach themselves to particles of air pollution, making these particles more likely to be trapped in the lung when inhaled. This phenomenon is sufficiently well recognised that pharmaceutical companies making inhalers are developing methods of charging up those aerosols to improve their effectiveness.
In this way people living near powerlines may be exposed to increased levels of air pollution. Crucially, corona ions can be carried several hundred metres from powerlines by the wind, so effects may be felt much further away than for magnetic fields. Fews and Henshaw, and colleagues at Bristol University (see refs) have estimated that corona ion effects, significant to adversely affect human health, extend to at least 400 metres from powerlines.
Bristol University found similar levels of corona ion pollution from 132kV lines as well as the much higher voltage lines studied in the Draper report (see refs). 132kV lines are much more common and straddle many houses and housing estates around the UK. Because of the quantity of research pointing towards serious health problems as a result of exposure to EMFs from power lines, etc., Powerwatch believes the Government should issue clear guidance to
- prevent any new building, especially homes, schools, nurseries, etc. within 250 metres of high-voltage powerlines
- enable the industry to start remedial work, such as undergrounding powerlines.
The regulator, OFGEM, should allow the industry to increase electricity prices slightly to fund this necessary work.
Although research has shown there is an increased risk of illness in high fields, most people, including most children, will not be seriously affected by them. It is important not to panic, but to take reasonable precautions.
.
Related articles
- Shielding Of Power Cables
- Reduction In The Cost Of Electricity
- Wind Power Applications
- Storage Systems
- Transformer Oil Diagnostics
2,739 views

The Power Factor Correction
The power factor of a load, which may be a single power-consuming item, or a number of items (for example an entire installation), is given by the ratio of P/S i.e. kW divided by kVA at any given moment.
The value of a power factor will range from 0 to 1. If currents and voltages are perfectly sinusoidal signals, power factor equals cos ϕ.
A power factor close to unity means that the reactive energy is small compared with the active energy, while a low value of power factor indicates the opposite condition.
Power vector diagram
- Active power P (in kW)
- Single phase (1 phase and neutral): P = V x I x cos ϕ
- Single phase (phase to phase): P = U x I x cos ϕ
- Three phase (3 wires or 3 wires + neutral): P = √3 x U x I x cos ϕ
- Reactive power Q (in kvar)
- Single phase (1 phase and neutral): P = V x I x sin ϕ
- Single phase (phase to phase): Q = UI sin ϕ
- Three phase (3 wires or 3 wires + neutral): P = √3 x U x I x sin ϕ
- Apparent power S (in kVA)
- Single phase (1 phase and neutral): S = VI
- Single phase (phase to phase): S = UI
- Three phase (3 wires or 3 wires + neutral): P = √3 x U x I
where:
V = Voltage between phase and neutral
U = Voltage between phases
- For balanced and near-balanced loads on 4-wire systems
The power factor is the ratio of kW to kVA. The closer the power factor approaches its maximum possible value of 1, the greater the benefit to consumer and supplier.
PF = P (kW) / S (kVA)
P = Active power
S = Apparent power
Current and voltage vectors, and derivation of the power diagram
The power vector diagram is a useful artifice, derived directly from the true rotating vector diagram of currents and voltage, as follows:
The power-system voltages are taken as the reference quantities, and one phase only is considered on the assumption of balanced 3-phase loading. The reference phase voltage (V) is co-incident with the horizontal axis, and the current (I) of that phase will, for practically all power-system loads, lag the voltage by an angle ϕ. The component of I which is in phase with V is the wattful component of I and is equal to I cos ϕ, while VI cos ϕ equals the active power (in kV) in the circuit, if V is expressed in kV.
The component of I which lags 90 degrees behind V is the wattless component of I and is equal to I sin ϕ, while VI sin ϕ equals the reactive power (in kvar) in the circuit, if V is expressed in kV.
If the vector I is multiplied by V, expressed in kV, then VI equals the apparent power (in kVA) for the circuit. The above kW, kvar and kVA values per phase, when multiplied by 3, can therefore conveniently represent the relationships of kVA, kW, kvar and power factor for a total 3-phase load, as shown in Figure K3 .
SOURCE: Schneider Electric
.
Related articles
- The Benefits of VFDs In HVAC Systems
- UPS design criteria and selection
- What is PowerLogic System?
- Substation, Its Function And Types
- General about motors
11,906 views

Field Test Procedure For Protective Relays
1. Relay Settings
At all new protective relay installations, the relays should be adjusted in accordance with the settings given in the relay data sheets, after which, tests should be made to determine if the actual operating characteristics check with the adjustments made. The Denver Office, Facilities Engineering Branch, must be advised of field changes of relay settings that become necessary from time to time as system operating conditions change to permit coordination with the Division of Design on future designs or revisions. Relays and relay settings are not to be changed from what is indicated on current issues of relay data sheets unless authorized by regional or project personnel with the proper responsibility.
.
2. Applying Revised Relay Settings
It is necessary to revise relay settings upward from time to time at many stations in preparation for anticipated increased unit output or line loading. At such times it may also be necessary to make corresponding changes in backup protective equipment in order to maintain coordination. Under these conditions, the changes in the backup relays should be made first so that coordination will not be lost during the period between beginning and completion of tests. This would apply whenever increased backup relay settings accompany changes in first-line protective equipment.
One case has been brought to our attention where new settings were applied to line relays but, because of lack of time, the backup ground relay was not reset until the following day. In the meantime, a fault occurred on the line, and the entire station was interrupted because the coordination had been lost. If the backup ground relay had been reset before settings were changed on line breaker relays, this interruption would not have occurred.
In a few rare cases relay settings may be revised downward at a station; and, in such cases, the opposite sequence must be followed in order to maintain coordination. When relay settings are revised downward, apply the new settings to the line breakers first and to the backup relays last.
.
3. New Installations
Before placing a new installation into operation, polarity of instrument transformers and the wiring to the relays should be checked. In some cases, the manufacturer’s polarity marking has been found to be incorrect. New relays should be inspected carefully and all blocking put in by the manufacturer removed. The test man should read instruction books furnished by the manufacturer to become familiar with construction and operating principle of the relays.
A sufficient number of initial operations should be made by manually operating relay contacts to make sure that all devices which should be operated by the relay, function freely and properly, including auxiliary contacts and targets within the relay. Breaker trip coils and other devices operated by the relay should be checked to see that proper operation is obtained at voltages considerably below normal (approximately 56 percent of normal voltage for breaker trip coils). The voltage drop in trip circuits and tripping current required should be checked. Factory adjustments on relays, other than taps, or other adjusting devices intended for customary adjustment should not be changed unless tests show that factory adjustments have been disturbed, in which case the manufacturers’ instruction books should be followed.
.
4. Testing Equipment Required
A good set of testing equipment and relay tools are important. Several manufacturers now produce portable relay test sets that will provided excellent results. If not available on the project, most of the equipment necessary can be borrowed from the Denver Office for making relay tests.
.
5. Testing Precautions
Before starting to test any relay on equipment in service, the person testing should become familiar with the relays and the circuits involved. Where test blocks are used, the person testing must make sure that in removing or inserting plugs that a current transformer circuit will not be opened, resulting in a voltage being built up which may be dangerous to personnel, property, or equipment, or cause an important circuit to trip out. In old installations where test blocks are not available, current transformer circuits must be short circuited by jumpers having reliable clamping devices which will not come loose, before the relay current circuit is opened.
.
6. Frequency Of Testing
It is recommended that protective and auxiliary relays be given a complete calibration test and inspection at least once a year. This schedule, however, sometimes cannot be met due to existing workloads and available manpower with the result that routine calibration tests intervals of many relays are longer than a year.
.
7. Test Records
A complete record should be kept of all test data and observations made during tests and inspections, including identifying numbers of test equipment used.
.
8. Annual Inspection
All relays shall be given an annual inspection. This inspection should include the following:
- A visual inspection should be made of all relays on a terminal including the tripping auxiliaries and accessories. Any drawout type relay should be withdrawn from its case for a closeup examination. All other, including auxiliaries, should at least have covers removed. Included in this visual inspection should be a check for loose connections, broken studs, burned insulation, and dirty contacts. Each relay should be checked to be in agreement with its setting sheet. On some distance relays it may have been necessary to set the taps on something other than specified values in order to get proper calibration. Because of this, it may also be necessary to check the taps against the last calibration test report.
- A test trip should be made of all relay systems. All relay elements which initiate some protective function should be checked. This includes reclosing, carrier starting, or any similar type function. After proving that tripping relays will successfully trip the circuit breaker and that all reclosing schemes work, continuity checks should be used, where applicable, to complete the checkout of the circuit breaker trip circuits.
.
9. Test Procedures
Tests to be performed during routine maintenance are determined by the type of relay to be tested. The following tests should be included for all electromechanical relays.
- A visual inspection of the relay cover can reveal valuable information. Any excessive dust, dirt, or. metallic material deposited on the cover should be noted and removed, thus preventing such material from entering the relay when the cover is removed. A cover glass which is fogged should be cleaned. Fogging is in most cases a normal condition due to volatile materials being driven out of coils and insulating materials, and is not an indication of a problem. However if fogging appears excessive, since most relays are designed to operate in ambient temperatures not exceeding 40EC (104EF), a further check of the ambient temperature would be in order. Voltage and current supplied to the relay should be checked and compared with the name plate or instruction book ratings. Should evidence of overheating be found, the insulation should be checked for embrittlement and, where necessary, replaced. Removal of the connection plug in drawout relays may reveal evidence of severe fault currents or contaminated atmospheres, either of which may indicate the advisability of a change in maintenance schedule. The condition of the relay contacts can be equally revealing.
- Mechanical adjustments and inspection should be made according to instructions shown following:
- Check to see that all connections are tight. Several loose connections could indicate excessive vibration which should be corrected.
- All gaps should be checked that they are freeof foreign material. If foreign material is found in the relay, the case gasket should be checked and replaced if necessary.
- All contact or armature gaps should bemeasured and values compared with previous measurements. Large variations in these measurements may indicate excessive wear, and worn parts should be replaced. Also an adjusting screw could have worked loose and must be tightened. All of this information should be noted on the test record.
- All contacts except those not recom-mended for maintenance should be burnished, and measured for alignment and wipe.
- Since checking bearings or pivotsusually involves dismantling the relay, it is recommended that such a test be made only when the relay appears to be extremely dirty, or when subsequent electrical tests indicate undue friction.
- Electrical tests and adjustments should be made according to the instructions shown following:
- Contact function.-Manually close oropen the contacts, and observe that they perform their required function; such as trip, reclose, or block.
- Pickup.-Gradually apply current or voltage to see that pickup is within limits. The current or voltage should be applied gradually in order to yield data which can be compared with previous or future tests and not be clouded by such effects as transient overreach.
- Dropout or reset.-To test for excessfriction, reduce current until the relay drops out or resets. Should the relay be sluggish in resetting or fail to reset, then the jewel bearing and pivot should be examined. A four power magnification is adequate for examining the pivot, and the jewel bearing can be examined with the aid of a needle which will reveal any cracks in it. If dirt is the problem, the jewel can be cleaned with an orange stick and the pivot can be wiped clean with a soft, lint free cloth. No lubricant should be used on either the jewel or pivot.
.
10. Auxiliary Relays
In addition to tests described in paragraph 9, auxiliary relays employing devices for time delay (for example, capacitors) should have an operating time test performed (either pickup or dropout, whichever is applicable).
.
11. Time Overcurrent And Time-Overvoltage Relays
All tests described in paragraph 9 should be performed for time-overcurrent and time-over-voltage relays where applicable. These types of relays should always be tested in the case in order to duplicate “in-service” conditions or to match published curves since the relay case normally acts as a shunt for flux that the electromagnetic iron circuit cannot handle due to saturation.
Testing the relay out of the case will also produce results that would not check previous tests or future tests since changes in test conditions, such as being near a steel cabinet, will change results obtained if the relay is tested out of the case. The first electrical test made on the relay should be a pickup test. Pickup is defined as that value of current or voltage which will just close the relay contacts from the
0.5 time-dial position. Allowing for such things asmeter differences and interpretations of readings, this value should be within ± 5 percent of previous data.
One or two points on the time-current curve are generally sufficient for maintenance purposes. Reset the relay to the original time-dial setting and check at two points such as 3 and 5 times pickup. Always use the same points for comparison with previous tests.
The instantaneous unit should be checked for pickup using gradually applied current. Whenever possible, current should be applied only to the instantaneous unit to avoid overheating the time unit. The target seal-in unit should also be tested using gradually applied current. The main unit contacts must be blocked closed for this test.
.
12. Directional Overcurrent Relays
In addition to tests recommended for the overcurrent relay, the directional unit of the directional overcurrent relay should be tested for minimum pickup, angle of maximum torque, contact gap, and clutch pressure. A test should also be made to check that the overcurrent unit operates only when the directional unit contacts are closed.
.
13. Distance Relays
When testing distance relays, tests should be made of pickup, angle of maximum torque, contact gap, and clutch pressure, in addition to the tests described in paragraph 9. (See appendix C for adjustment of Westinghouse Type KD relays).
.
14. Differential Relays
A test of minimum pickup should be performed for differential relays. The differential characteristic (slope) should be checked, and where applicable, the harmonic restraint should be tested. Differential relays using ultrasensitive polarized units as sensing devices are slightly affected by previous history, such as heavy internal or external fault currents. It is therefore recommended that for this type of relay two pickup readings be taken and the second reading be the one that is used for comparison with previous and future tests.
.
15. Static Relays
Static relays should be tested in accordance with manufacturer’s recommendations given in relay instruction books. As there are no moving parts in static relays, there is no physical wear due to usage and no need for lubricants. Prime causes of failure in electronic components are heat, vibration, and moisture. Overheating can be caused by voltage transients, current surges, excessive power, or high ambient temperature.
Vibration can loosen or break leads and connections and can crack component casings or insulation resulting in equipment failure. Moisture can result in corrosion of metallic elements which can result in circuit discontinuities, poor contact, or shorts. Preventive maintenance of static relays should be directed toward removing causes of failure listed above by doing the following:
- Keep equipment clean by periodic vacuuming or blowing out of dirt, dust, and other surface contaminants.
- Keep the equipment dry and protectedagainst moisture and corrosion.
- Inspect to see that all connections, leads,and contacts are tight and free as possible from effects of vibration.
- Check to see that there is adequateventilation to conduct heat away efficiently.
Preventive measures should not be applied unnecessarily as this may contribute to failures. For example, printed circuit cards should not be pulled from their racks to be inspected if there is no real need. Operating test switches unnecessarily may introduce damaging voltage transients.
.
16. Portable Relay Panels
Particular attention should be given to relays mounted on portable relay panels as these relays are subjected to more rough handling than those permanently installed on a switchboard. Therefore, whenever a portable panel of relays is installed, they should be thoroughly checked physically as well as electrically. If they are in bad condition, they should be repaired, or new relays installed before they are placed in service.
.
17. Circuit Burden Measurements For CT’S
When CT circuits are modified such as by addition of relays, meters, or auxiliary CT’s, measurements should be taken to determine the burden of the overall CT secondary circuit. These measurements should normally be on a phase-to-neutral basis. Measurements should be made at three current levels, such as 1, 3, and 5, while recording volts, amps, and phase angle. When auxiliary CT’s are involved, additional and separate measurements should be taken on the secondary circuit of the auxiliary CT’s.
.
18. Excitation Curves For CT’S
Auxiliary CT’s tend to saturate at much less secondary current and burden than large multi-ratio bushing type CT’s. Excitation curves should be available on all CT’s, especially on auxiliary CT’s used in protective relaying circuits (fig. 1). Such curves can be derived by open-circuiting the primary, and driving the secondary with a 60-Hertz source while measuring voltage and current. Readings should be taken up to two times rated secondary current or to the point where voltage applied is 1500 volts.
.
19. Grounding CT And PT Circuits
The CT and PT circuits should be grounded at only one point. Relay misoperations can be caused by grounding the neutral at two points, such as one ground at the switchyard and another at the relay panel. At least once every 3 years with the primary deenergized, the known ground should be removed and the overall circuits should be checked for additional grounds and insulation breakdowns.
.
20. Open-Secondary Circuits
WARNING: Secondary circuits of CT’s must not be open while primary current flows.
Extreme care should be taken to avoid breaking the secondary circuit while primary current is flowing. If the secondary is open-circuited the primary current raises core flux density to saturation and induces a high voltage in the secondary which can endanger human life, and can damage connected apparatus and leads. If it is necessary to change secondary conditions while primary current is flowing, the secondary terminals must be short-circuited while the change is being made. Caution should be exercised when working with differential circuits as shorting a current transformer in an energized differential relaying circuit could result in a relay operation.
It is recommended that the secondaries of all current transformers be kept short-circuited at all times when not installed in a circuit such as being held in stock or being transported.
.
21. Tempererature Relays
Temperature relays used on bearings and for other important purposes should be checked for correct operation by placing the bulb in a pail of water with a thermometer, and gradually heating to the temperature at which the relay is set to operate. A mercury or alcohol thermometer should be used to read the temperature while the water is being stirred.
Record temperature at which the relay operates on increasing temperature and at which it resets on falling temperature. Temperature relays operating from RTD’s (resistance temperature detectors) should be checked by heating the detectors slowly in an enclosed air space since they should not be immersed in water or other liquid.
.
22. Pressure Relays
Pressure relays should be checked for correct operation by comparing with an accurate pressure gage. Pressure should be increased and decreased to determine the pressure at which the relay operates and resets. The above does not apply to sudden pressure relays, which should be maintained in accordance with the manufacturer’s recommendations.
.
Related articles
- Line Protection With Distance Relays
- ABB Power Transformers – A guide to manufacturing
- High Voltage Substation Earth Grid Impedance Testing
- ABB Feeder Protection REF615 ANSI
- Procedure for the establishment of a new substation

FIGURE 1 – Voltage gradient around a substation under fault condition
The purpose of this paper is to report a new test method and make a recommendation to improve the procedures according to the findings.
The test method involves measurement of high voltage substations earth grid impedance, by utilization of a variable frequency current source and frequency selective measurement techniques.
Safety policies require that the values of earth impedances remain within the specified acceptable range and every utility is required to guarantee safe step-and-touch potential levels. It is therefore necessary to carry out periodic testing on substation earthing to monitor the condition of the substation earthing system.
Knowledge of earth grid impedance of high voltage substations is also very important for correct operation of protection schemes and fault clearance. As the condition of grounding components change over time due to corrosion of earth cables, changes in the adjacent infrastructures and so on, it is necessary to measure the impedance of earthing grid periodically to ensure that the values are within expected range.
Knowledge of the overall resistance ZE allows calculation of the total voltage rise of a substation under maximum fault current. Knowledge of the voltage gradient around the substation, especially close to the substation allows calculation of the step-andtouch voltages under worst-case conditions.
Measurement principle
According to international standards such as CENELEC HD637S1 [1] or ANSI IEEE 80-2000 [2], 81-1983 [3] it is recommended to use a current-voltage method otherwise known as fall-of-potential [4].
Generally in a 90° angle (birds-eye view) two electrodes are placed outside the influence of the grounding system under test. One is used to inject the current (current electrode) and one to measure the voltage (voltage electrode). However because the area which is influenced by the grounding system is not so easy to determine, the current electrode is usually placed at a distance of at least 10 times, and up to 15 to 20 times the diameter of the grounding system under test. The voltage electrode then is placed in various distances.
Close to the system under test, large voltage degradation is visible. The further the voltage probe is located from the system under test, the more stable the measured voltages become (FIGURE 2 & 6).

FIGURE 2 – Voltage Degradation
Problems with Conventional Measurement Methods
For small grounding systems like a single tower, it is generally no problem to place the two needed electrodes and low currents generated by battery-operated equipment can generally do the job satisfactorily. However when measuring large substations, the distances are substantial and should be as large as 10 to 20 times the diameter of the substation. In some cases, measurements show peaks and drops until an area free of buildings and buried conductors or pipes is reached. Until then, erroneous results can be obtained.
Voltage drops can be observed when measurement points are set close to objects, like towers of power lines leaving the substation, connected to the grounding system under test. Voltage rises can be observed when for example measurement points are placed over a buried pipe that runs close to the current electrode. Therefore it is often difficult to distinguish between drops, rises and stable results.
To place the current electrode very far away is certainly a good idea, because then at least the influence of the current electrode can be minimized, however here the effort becomes even bigger. The biggest challenge is when the current electrode has to be relocated several times, before a stable measurement can be achieved.
Usage of existing power lines
One method to overcome these measurement problems is to use diesel generators (weighing several tons) to generate currents that have frequencies slightly different from mains frequency and to feed in the currents over existing, de-energized power lines leaving the substation. The grounding system of the remote substation where the power line terminates is used as current electrode (see FIGURE 2 Impedance Measurement).
The amount of current needed for such a test still has to be quite large to overcome mains frequency disturbances and the power requirement is enormous. But with these devices it is possible to measure ground impedances. However, the effort is by far too high to use it as a realistic approach for maintenance measurements.
Combination of the good ideas

FIGURE 3 – Test equipment for line impedance measurement
A new approach of Omicron is to combine the principle of simple battery operated equipment based on the variable frequency principle and use the existing power lines and the grounding system of the remote substation as current electrode.
The test set CPC 100 and CP CU1 from OMICRON comprises of a frequency variable amplifier (29 kg), a coupling unit (28 kg) and a protection device (6 kg).
The CPC 100 is a multi-functional, frequency-variable test set for testing various primary equipments. It is capable of generating currents up to 800 A or voltages up to 2000 V, with special software modules to be used for various automated tests on CTs, VTs, power transformers or other primary equipments. With other accessories it can also be used for tangent delta testing on power transformer bushings or windings, with test voltages up to 12 kV.
In the application of ground impedance measurement it is used as frequency variable power generator, measurement tool and analyzer. Due to the variable frequency generation, it is possible to generate signals first under and then above mains frequency. Using digital filter algorithms, the test set will measure only the signal with the frequency that is currently generated and filters out signals at other frequencies. Disturbances due to noise and electrical interference thus no longer influence the result.

FIGURE 4 – Frequency selective measurement
For safety reasons, the coupling unit CP CU1 is used for galvanic decoupling of the current output and the measurement inputs from the power line. This way, if fault or lightning occur during the test, the operator can be safe from dangerous voltages. For optimum performance there is a range selector switch for the current output, and a built-in voltmeter for a quick check of induced voltages or burden. Test currents of up to 100A can be generated for short cables, and for long lines of up to a few hundred kilometers, currents over 1A are still possible.
The protection device CP GB1 is a tool for easy connection to the overhead line or power cable and existing grounding cables of the substation may be used. In case of unexpected high voltage on the power line due to faults on a parallel system, lightning discharges or transients due to switching operations, the GB1 is capable of discharging short transients or permanently shorting fault currents of up to 30 kA for at least 100 ms. These features will protect the operator in unexpected situations.
The test itself is simple: the combination of CPC 100, CP CU1 and CP GB1 is connected to a de-energized power line (FIGURE 2&5); after removing the near end ground connection, test current with a different frequency than the mains frequency is injected. The voltage test probe then is located at various distances until stable voltage measurements can be observed. At this point the measurement is completed And the results can be stored in the CPC, downloaded to a PC and analyzed in a Microsoft Excel application.
Case study
The test was carried out on 7th October 2004 by confirming outage on Western Power Corporation’s Landsdale Northern Terminal line. Northern Terminal Substation was the remote terminal and the earth grid at Landsdale Substation was measured.
Earth Switches at both substations were closed and portable earths were applied to the lines in preparation for the test.
CPC 100 and CP CU20 (a predecessor of the CP CU1) were connected to the line as per test set up and voltage measurements stake was inserted at different distances from the test point in a different direction from that of the transmission line in order to avoid induction. Measurements were carried out and test files were saved to the CPC 100 memory to be retrieved in the office.
Test was performed at various frequencies (between 30-110 Hz) to suppress the noise and achieve a precise characteristic of the grid impedance under test. Impedances for 50Hz were extrapolated from the test results.

FIGURE 5 – Measurement of Landsdale Local Substation's Earth Grid
The mass of the earth is not the only path for feeding the ground current. All metal structures such as pipes tubes, railway lines and Multiple Earthed Neutral (MEN) of distribution systems between the test point and the current auxiliary electrode form the path for the ground current, including the shield wire on the top of the pole.
Test Results
The graph for the impedance measurement was as follows:
FIGURE 6 – Voltage degradation measurement results
The impedance profile of the earthing system was obtained and the stabilization of the impedance at a distance above 100m was obvious.
This data was then used to calculate the earthgrid potential rise during maximum earth fault conditions.
Conclusion
Substation earthing system testing using the conventional method is arduous, time consuming and involves multiple heavy equipment producing end results that are sometimes unreliable due to electrical interference and noise. The conventional method requires high test currents in order to achieve a higher signal-to-noise ratio, therefore heavy equipment and generators are required to produce such currents.
The alternative method using variable frequency technique, achieves the desired outcome with less cost, effort and resources and increases efficiency and accuracy.
AUTHORS
Dean SHARAFI – WESTERN POWER (Australia)
Ulrich KLAPPER – OMICRON electronics (Australia)
.
Related articles
- ABB launches new generation 420kV gas insulated switchgear
- ABB Power Transformers – A guide to manufacturing
- Line Protection With Distance Relays
- Substation, Its Function And Types
- Current Switching with High Voltage Air Disconnector
21,240 views

PLC-Based Monitoring Control System
With the rapidly changes on industries and information technologies in recent years, some traditional bulk electronic appliances have to be monitored for a long time. All of their control devices such as communication interfaces gradually enter the Intemet information era. The control of all equipment has been performed through the use of computers.
Most equipment uses PLC to connect with computers to monitor each load and electricity consuming devices. Programmable Logic Controllers (PLC) are widely used in industrial control because they are inexpensive, easy to install and very flexible in applications. A PLC interacts with the external world through its inputs and outputs.
PLC as a System Controller
Programmable logic controllers are modular, industrially hardened computers which perform control functions through modular input and output (I/O) modules. The modularity of PLC allows the user to combine generic I/O modules with a suitable controller to form a control system specific to his is most simply understood needs. The operation of a controller by envisioning that it repeatedly performs three steps:
- Reads inputs from input modules
- Solves preprogrammed control logic
- Generates outputs to output modules based on the control logic solutions. Input devices and output devices of the process are connected to the PLC and the control program is entered into the PLC memory (Fig.1).

Fig. 1. Control Action of a PLC
In our application, it controls through analog and digital inputs and outputs the varying load-constant speed operation of an induction motor.
Also, the PLC continuously monitors the inputs and activates the outputs according to the control program. This PLC system is of modular type composed of specific hardware building blocks (modules), which plug directly into a proprietary bus: a central processor unit (CPU), a power supply unit, input-output modules I/O and a program terminal.
Such a modular approach has the advantage that the initial configuration can be expanded for other future applications such as multi machine systems or computer linking [2].
Control System of Induction Motor
The software models generated in the Software Requirements Analysis phase of the development project are refined and embellished in the design phase of the project. This phase involves making implementation decisions such as the interfacing between different software modules, the break down of software across multiple processors, assigning inputs and outputs to I/O cards, etc. PLC software, once written must be easy and intuitive to follow.
PLCs are an integrated part of the domain system, advances in the technology of the system will effect the requirements of the PLC software. PLC software must therefore be maintainable and extensible [18].

Fig. 2. Experimental setup
In Fig. 2, the block diagram of the experimental system is illustrated. The following configurations can be obtained from this setup.
- A closed-loop control system for constant speed operation, configured with speed feedback. The induction motor drives a variable load, is fed by an inverter and the PLC controls the inverter output.
- An open-loop control system for variable speed and variable frequency operation. The induction motor drives a variable load and is fed by control mode. The PLC is an inverter in constant in activated.
- The standard variable speed operation. The induction motor drives a variable load and is fed by a constant voltage-constant frequency standard three-phase supply.
The open-loop configuration (2.) can be obtained from the closed-loop configuration (1.) by removing the speed feedback. On the other hand, operation c) results if the entire control system is bypassed. [6-7] PLC’s programming is based on the logic demands of input devices and the programs implemented are predominantly logical rather than numerical computational algorithms. Most of the programmed operations work on a straightforward two-state “on or off” basis and these alternate possibilities correspond to “true or false” (logical form) and“ 1 or 0” (binary form), respectively. Thus, PLCs offer a flexible programmable alternative to electrical circuit relay-based control systems built using analog devices.
The programming method used is the ladder diagram method. The PLC system provides a design environment in the form of software tools running on a host computer terminal which allows ladder diagrams to be developed, verified, tested, and diagnosed. First, the high-level program is written in ladder diagrams. Then, the ladder diagram is converted into binary instruction codes so that they can be stored in random-access memory (RAM) or erasable programmable read-only memory (EPROM). Each successive instruction is decoded and executed by the CPU. The function of the CPU is to control the operation of memory and I/O devices and to process data according to the program. Each input and output connection point on a PLC has an address used to identify the I/O bit. The method for the direct representation of data associated with the inputs, outputs, and memory is based on the fact that the PLC memory is organized into three regions: input image memory (I), output image memory (Q), and internal memory (M).

Fig.3. Flowchart of the main program
Any memory location is referenced directly using %I, %Q, and %M (Table III). The PLC program uses a cyclic scan in the main program loop such that periodic checks are made to the input variables (Fig.3). The program loop starts by scanning the inputs to the system and storing their states in fixed memory locations (input image memory I).
The ladder program is then executed rung-by-rung. Scanning the program and solving the logic of the various ladder rungs determine the output states. The updated output states are stored in fixed memory locations (output image memory Q). The output values held in memory are then used to set and reset the physical outputs of the PLC simultaneously at the end of the program scan. For the given PLC, the time taken to complete one cycle or the scan time is 0, 18 ms/K (for 1000 steps) and with a maximum program capacity of 1000 steps.
The development system comprises a host computer (PC) connected via an RS232 port to the target PLC. The host computer provides the software environment to perform file editing, storage, printing, and program operation monitoring.
The process of developing the program to run on the PLC consists of: using an editor to draw the source ladder program, converting the source program to binary object code which will run on the PLC’ s microprocessor and downloading the object code from the PC to the PLC system via the serial communication port.
The PLC system is online when it is in active control of the machine and monitors any data to check for correct operation.

Table 1. Induction Motor Technical Specifications
.

Table 2. Inverter Technical Specifications
.

Table 3. PLC Configuration
.
As a microprocessor-based system, the PLC system hardware is designed and built up with the following modules [7]:
- Central processor unit (CPU)
- Discrete output module (DOM)
- Discrete input module (DIM)
- Analog outputs module (AOM)
- Analog inputs module (AIM)
- Power supply

Fig. 4. Flowchart of speed control software
In Fig.4, the flowchart of the speed control software is illustrated. The software regulates the speed and monitors the constant speed control regardless of torque variation. The inverter being the power supply for the motor executes this while, at the same time, it is controlled by PLC’ s software. The inverter alone can not keep the speed constant without the control loop with feedback and PLC. From the control panel, the operator selects the speed set point nsp and forward/backward direction of rotation. Then, by pushing the manual start pushbutton, the motor begins the rotation. If the stop button is pushed, then the rotation stops.
The corresponding input signals are interfaced to the DIM and the output signals to the DOM. The AIM receives the trip signal from the stator current sensor, the speed feedback signal from the tacho-generator, and the signal from the control panel. In this way, the PLC reads the requested speed and the actual speed of the motor. The difference between the requested speed by the operator and the actual speed of the motor gives the error signal. If the error signal is not zero, but positive or negative, then the PLC according to the computations carried out by the CPU decreases or increases the V/f of the inverter and, as a result, the speed of the motor is corrected.
The implemented control is of proportional and integral (PI) type (i.e., the error signal is multiplied by gain Kp, integrated and added to the requested speed). As a result, the control signal is sent to the DOM and connected to the digital input of the inverter to control V/f variations. At the beginning, the operator selects the gain Kp, by using a rotary resistor mounted on the control panel (gain adjust) and the AIM receives its voltage drop as controller gain signal (0–10 V). The requested speed nsp is selected using a rotary resistor and the AIM reads this signal. Its value is sent to the AOM and displayed at the control panel (speed set point display).

Fig. 5. Flowchart of monitor and protection Software
Another display of the control panel shows the actual speed computed from the speed feedback signal. In Fig. 5, the flowchart of this software is shown.
During motor operation, it is not possible to reverse its direction of rotation by changing the switch position. Before direction reversal, the stop button must be pushed. For motor protection against overloading currents during starting and loading, the following commands were programmed into the software.
1. Forward/backward signal is input to DIM
2. Speed set point signal nsp, the stator current IS and the speed feedback signal are input to AIM.
3. At no load, Is ≤ 2,5 A, if the speed set point is lower than 20% or nsp< 300 r/min, the motor will not start.
4. At an increased load over 3,2 Nm (40% of rated torque), Is ≥ ,3 A and a speed set point lower than 40% or nsp< 600 r/min, the motor will not start.
5. If the load is increased more than 8,0Nm (rated torque) Is ≥ 4 A and if the speed set point exceeds 100% or nsp≥ 1500 r/min, the motor enters the cut off procedure.
6. In all other situations, the motor enters in the speed control mode and the speed control software is executed as described in Subsection A.
In Fig. 6, the flowchart of this software is shown.

Fig. 6. Flowchart of cutoff/restart motor software
- In overloading situations, the motor is cut off and the trip lamp (yellow) is lit. The operator must release the thermal relays and then must turn off the trip lamp by pushing trip or stop button. The thermal relays are set to the motor rated current 4 A. Following this, the motor can be started again.
- The motor can be cut off by the operator pushing the stop button: the display of the actual speed is set to zero, the start lamp (green) turns off, and the stop lamp (red) turns on and remains lit for 3 s.
- The load must be disconnected immediately after the motor cuts off and before the drive system is restarted. The motor will not start before 3 s after cutoff even if the start button is pushed.
Results
The system was tested during operation with varying loads including tests on induction motor speed control performance and tests for trip situations. The PLC monitors the motor operation and correlates the parameters according to the software. At the beginning, for reference purposes, the performance of induction motor supplied from a standard 380V, 50-Hz network was measured. Then, the experimental control system was operated between no load and full load (8, 0 Nm) in the two different modes described above:
- Induction motor fed by the inverter and with PLC control
- Induction motor fed by the inverter

Fig. 7. Experimental speed torque characteristics with PLC and inverter
The range of load torque and of speed corresponds to the design of the PLC hardware and software as described in the previous sections. The speed versus torque characteristics were studied in the range 500–1500 r/min and are illustrated in Fig. 7. The results show that configuration b) operates with varying speedvarying load torque characteristics for different speed set points nsp.
Configuration (1.) operates with constantspeed-varying load torque characteristics in the speed range 0–1400 r/min and 0–100% loads. However, in the range of speeds higher than 1400 r/min and loads higher than 70%, the system operates with varying-speedvarying-load and the constant speed was not possible to be kept. Thus, for nsp ≥ 1400 r/min both con-figurations (1.) and (2.) have a similar torque-speed response. This fact shows that PI control for constant speed as implemented by the software with PLC is effective at speeds lower than 93% of the synchronous[4-7].

Fig. 8. Efficiency of controlled system
The efficiency for different values of nsp was also studied. As depicted in Fig. 8, the results show that configuration (1.) in all cases has a higher efficiency than configuration (2.). Also, at operation with loads higher than 70%, the normalized efficiency is η(pu)> 1, meaning that the obtained efficiency with PLC control is higher than the efficiency of induction motor operated from the standard 380-V, 50-Hz network without the control of PLC and without the inverter.
According to this figure, the efficiency of PLC-controlled system is increased up to 10–12% compared to the standard motor operation. From a theoretical point of view, if we neglect magnetizing current, an approximate value for the efficiency is
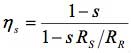
where is the slip and Rs and Rr are the stator and rotor winding resistances, respectively. As can be seen from Fig. 7, the PLC controlled system a) works with very low slip values, almost zero. In all speed and load torque conditions, the configuration (1.) has a smaller slip than configuration (2.), thus the higher values of efficiency can be justified and especially at high speeds and frequencies. At lower frequencies, the magnetic flux increases and, thus, there is an increase in magnetizing current resulting in increased losses. This system presents a similar dynamic response as the closed-loop system with V/f speed control. Its transient performance is limited due to oscillations on torque and this behavior restricts the application of this system to processes that only require slow speed variation.
Conclusion
Successful experimental results were obtained from the previously described scheme indicating that the PLC can be used in automated systems with an induction motor.
The monitoring control system of the induction motor driven by inverter and controlled by PLC proves its high accuracy in speed regulation at constant-speedvariable-load operation. The effectiveness of the PLC-based control software is satisfactory up to 96% of the synchronous speed. The obtained efficiency by using PLC control is increased as compared to the open-loop configuration of the induction motor fed by an inverter. Specifically, at high speeds and loads, the efficiency of PLC-controlled system is increased up to 10–12% as compared to the configuration of the induction motor supplied from a standard network.
Despite the simplicity of the speed control method used, this system presents:
- constant speed for changes in load torque
- full torque available over a wider speed range
- very good accuracy in closed-loop speed control scheme
- higher efficiency;
- overload protection
Thus, the PLC proved to be a versatile and efficient control tool in industrial electric drives applications.
AUTHORS:
YASAR BIRBIR, H.SELCUK NOGAY
Marmara University, Technical Education Faculty, Department of Electricity Education
Goztepe, 34722 Istanbul, TURKEY.
ybirbir@marmara.edu.tr, selcuknogay@marmara.edu.tr
.
Related articles
- Video Surveillance in Power Substations
- Energy management
- What is PowerLogic System?
- General about motors
- Paralleling Three-Phase Transformers
8,774 views

Gezhou HidroPower Dam
Hydropower (from hydro meaning water) is energy that comes from the force of moving water. The fall and movement of water is part of a continuous natural cycle called the water cycle. Energy from the sun evaporates water in the earth’s oceans and rivers and draws it upward as water vapor.
When the water vapor reaches the cooler air in the atmosphere, it condenses and forms clouds. The moisture eventually falls to the earth as rain or snow, replenishing the water in the oceans and rivers. Gravity drives the water, moving it from high ground to low ground. The force of moving water can be extremely powerful.
Hydropower is called a renewable energy source because the water on the earth is continuously replenished by precipitation. As long as the water cycle continues, we won’t run out of this energy source.
History of Hydropower
Hydropower has been used for centuries. The Greeks used water wheels to grind wheat into flour more than 2,000 years ago. In the early 1800s, American and European factories used the water wheel to power machines. The water wheel is a simple machine. The water wheel is located below a source of flowing water.
It captures the water in buckets attached to the wheel and the weight of the water causes the wheel to turn. Water wheels convert the potential energy (gravitational energy) of the water into motion. That energy can then be used to grind grain, drive sawmills, or pump water.
In the late 19th century, the force of falling water was used to generate electricity. The first hydroelectric power plant was built at Niagara Falls in 1879. In the following decades, many more hydroelectric plants were built. At its height in the early 1940s, hydropower provided 33 percent of this country’s electricity.
By the late 1940s, the best sites for big dams had been developed. Inexpensive fossil fuel plants also entered the picture. At that time, plants burning coal or oil could make electricity more cheaply than hydro plants. Soon they began to underprice the smaller hydroelectric plants. It wasn’t until the oil shocks of the 1970s that people showed a renewed interest in hydropower.
Hydro Dams
It’s easier to build a hydro plant where there is a natural waterfall. That’s why the first hydro plant was built at Niagara Falls. Dams, which are artificial waterfalls, are the next best way.
Dams are built on rivers where the terrain will produce an artificial lake or reservoir above the dam. Today there are about 80,000 dams in the United States, but only three percent (2,000) have power-generating hydro plants. Most dams are built for flood control and irrigation, not electric power generation. A dam serves two purposes at a hydro plant. First, a dam increases the head or height of the water. Second, it controls the flow of water. Dams release water when it is needed for electricity production. Special gates called spillway gates release excess water from the reservoir during heavy rainfalls.
Hydropower Plants

Hydropower Plant Parts
As people discovered centuries ago, the flow of water represents a huge supply of kinetic energy that can be put to work. Water wheels are useful for generating mechanical energy to grind grain or saw wood, but they are not practical for generating electricity. Water wheels are too bulky and slow.
Hydroelectric plants are different. They use modern turbine generators to produce electricity, just as thermal (coal, oil, nuclear) power plants do, except that they do not produce heat to spin the turbines.
How a Hydro Plant Works
A typical hydro plant is a system with three parts:
- a power plant where the electricity is produced.
- a dam that can be opened or closed to control water flow
- a reservoir (artificial lake) where water can be stored
To generate electricity, a dam opens its gates to allow water from the reservoir above to flow down through large tubes called penstocks. At the bottom of the penstocks, the fast-moving water spins the blades of turbines. The turbines are connected to generators to produce electricity. The electricity is then transported via huge transmission lines to a local utility company.
Head and Flow
The amount of electricity that can be generated at a hydro plant is determined by two factors: head and flow. Head is how far the water drops. It is the distance from the highest level of the dammed water to the point where it goes through the power-producing turbine.
Flow is how much water moves through the system––the more water that moves through a system, the higher the flow. Generally, a high-head plant needs less water flow than a low-head plant to produce the same amount of electricity.
Storing Energy
One of the biggest advantages of a hydropower plant is its ability to store energy. The water in a reservoir is, after all, stored energy. Water can be stored in a reservoir and released when needed for electricity production.
During the day when people use more electricity, water can flow through a plant to generate electricity. Then, during the night when people use less electricity, water can be held back in the reservoir. Storage also makes it possible to save water from winter rains for summer generating power, or to save water from wet years for generating electricity during dry years.
Pumped Storage Systems
Some hydro plants use pumped storage systems. A pumped storage system operates much as a public fountain does. The same water is used again and again. At a pumped storage hydro plant, flowing water is used to make electricity and then stored in a lower pool. Depending on how much electricity is needed, the water may be pumped back to an upper pool. Pumping water to the upper pool requires electricity so hydro plants usually use pumped storage systems only when there is peak demand for electricity.
Pumped hydro is the most reliable energy storage system used by American electric utilities. Coal and nuclear power plants have no energy storage systems. They must turn to gas and oil-fired generators when people demand lots of electricity. They also have no way to store any extra energy they might produce during normal generating periods.
Hydropower Production
How much electricity do we get from hydropower today? Depending on the amount of rainfall, hydro plants produce from five to ten percent of the electricity produced in this country (10 percent in 1997, 5.9 percent in 2008 due to the droughts in the west. In Oregon, Washington, and Idaho, hydropower supplies over 73 percent of the electricity each year. Today, there are about 78 million kilowatts of hydro generating capacity in the United States. That’s equivalent to the generating capacity of 80 large nuclear power plants. The biggest hydro plant in the U.S. is located at the Grand Coulee Dam on the Columbia River in northern Washington State. The United States also gets some hydropower generated electricity from Canada.
Some New England utilities buy this imported electricity. What does the future look like for hydropower? The most economical sites for hydropower dams have already been developed so the development of big hydro plants is unlikely. Existing plants could be enlarged to provide additional generating capacity. Plus, many flood-control dams not equipped for electricity production could be retrofitted with generating equipment. The Federal Energy Regulatory Commission estimates 30 thousand megawatts of additional generating capacity could be developed in the United States.
Hydropower for Baseload Power
Demand for electricity is not steady; it goes up and down. People use more electricity during the day when they are awake and using electrical appliances, and less at night when they are asleep.
People also use more electricity when the weather is very cold or very hot. Electric utility companies have to produce electricity to meet these changing demands. Baseload power is the electricity that utilities have to generate all the time. For that reason, baseload power should be cheap and reliable. Hydropower meets both these requirements.
Generating electricity with hydropower is the cheapest way to generate electricity in the U.S., and the fuel supply flowing water is always available. Hydro plants are more energy efficient than most thermal power plants, too. That means they waste less energy to produce electricity. In thermal power plants, a lot of energy is lost as heat. Hydro plants are about 95 percent efficient at converting the kinetic energy of the moving water into electricity.
Economics of Hydropower
Hydropower is the cheapest way to generate electricity today. No other energy source, renewable or nonrenewable, can match it.
Today, it costs about one cent per kWh (kilowatt-hour) to produce electricity at a typical hydro plant. In comparison, it costs coal plants about three cents per kWh and nuclear plants about two cents per kWh to generate electricity. Producing electricity from hydropower is cheap because, once a dam has been built and the equipment installed, the energy source—flowing water—is free.
Hydropower plants also produce power cheaply due to their sturdy structures and simple equipment. Hydro plants are
dependable and long-lived, and their maintenance costs are low compared to coal or nuclear plants. One requirement may increase hydropower’s costs in the future. The procedure for licensing and relicensing dams has become a lengthy
and expensive process. Many environmental impact studies must be undertaken and as many as 13 state and federal agencies must be consulted. It takes anywhere from three to seven years to get a license to build a hydroelectric dam or a relicense to continue operations.
Hydropower and the Environment

Hydropower can potentially harm fish
Hydropower dams can cause several environmental problems, even though they burn no fuel. Damming rivers may permanently alter river systems and wildlife habitats.
Fish, for one, may no longer be able to swim upstream. Hydro plant operations may also affect water quality by churning up dissolved metals that may have been deposited by industry long ago. Hydropower operations may increase silting, change water temperatures, and lower the levels of dissolved oxygen.
Some of these problems can be managed by constructing fish ladders, dredging the silt, and carefully regulating plant
operations. Hydropower has advantages, too. Hydropower’s fuel supply (flowing water) is clean and is renewed yearly by snow and rainfall. Furthermore, hydro plants do not emit pollutants into the air because they burn no fuel. With growing concern over greenhouse gas emissions and increased demand for electricity, hydropower may become more important in the future.
Hydropower facilities offer a range of additional benefits. Many dams are used to control flooding and regulate water supply, and reservoirs provide lakes for recreational purposes, such as boating and fishing.
.
Related articles
- Hydropower – Systems Overview (1)
- Introduction To Micro Hydropower
- Hydropower – Systems Overview (2)
- The Nature Of Reactive Energy
- Storage Systems
2,781 views
One of the significant challenges that substation engineers face is justifying substation automation investments. The positive impacts that automation has on operating costs, increased power quality, and reduced outage response are well known. But little attention is paid to how the use of a communication standard impacts the cost to build and operate the substation. Legacy communication protocols were typically developed with the dual objective of providing the necessary functions required by electric power systems while minimizing the number of bytes that were used by the protocol because of severe bandwidth limitations that were typical of the serial link technology available 10-15 years ago when many of these protocols were initially developed. Later, as Ethernet and modern networking protocols like TCP/IP became widespread, these legacy protocols were adapted to run over TCP/IP-Ethernet.
This approach provided the same basic electric power system capabilities as the serial link version while bringing the advantages of modern networking technologies to the substation. But this approach has a fundamental flaw: the protocols being used were still designed to minimize the bytes on the wire and do not take advantage of the vast increase in bandwidth that modern networking technologies deliver by providing a higher level of functionality that can significantly reduce the implementation and operational costs of substation automation.
IEC 61850 is unique. IEC 61850 is not a former serial link protocol recast onto TCP/IP-Ethernet. IEC 61850 was designed from the ground up to operate over modern networking technologies and delivers an unprecedented amount of functionality that is simply not available from legacy communications protocols. These unique characteristics of IEC 61850 have a direct and positive impact on the cost to design, build, install, commission, and operate power systems. While legacy protocols on Ethernet enable the substation engineer to do exactly the same thing that was done 10-15 years ago using Ethernet, IEC 61850 enables fundamental improvements in the substation automation process that is simply not possible with a legacy approach, with or without TCP/IP-Ethernet. To better understand the specific benefits we will first examine some of the key features and capabilities of IEC 61850 and then explain how these result in significant benefits that cannot be achieved with the legacy approach
Key Features
The features and characteristics of IEC 61850 that enable unique advantages are so numerous that they cannot practically be listed here. Some of these characteristics are seemingly small but yet can have a tremendous impact on substation automation systems.
For instance, the use of VLANs and priority flags for GOOSE and SMV enable much more intelligent use of Ethernet switches that in and of itself can deliver significant benefits to users that aren’t available with other approaches. For the sake of brevity, we will list here some of the more key features that provide significant benefits to users:
- Use of a Virtualized Model. The virtualized model of logical devices, logical nodes, ACSI, and CDCs enables definition of the data, services, and behavior of devices to be defined in addition to the protocols that are used to define how the data is transmitted over the network.
- Use of Names for All Data. Every element of IEC 61850 data is named using descriptive strings to describe the data. Legacy protocols, on the other hand, tend to identify data by storage location and use index numbers, register numbers and the like to describe data.
- All Object Names are Standardized and Defined in a Power System Context. The names of the data in the IEC 61850 device are not dictated by the device vendor or configured by the user. All names are defined in the standard and provided in a power system context that enables the engineer to immediately identify the meaning of data without having to define mappings that relate index numbers and register numbers to power system data like voltage and current.
- Devices are Self-Describing. Client applications that communicate with IEC 61850 devices are able to download the description of all the data supported by the device from the device without any manual configuration of data objects or names.
- High-Level Services. ACSI supports a wide variety of services that far exceeds what is available in the typical legacy protocol. GOOSE, GSSE, SMV, and logs are just a few of the unique capabilities of IEC 61850.
- Standardized Configuration Language. SCL enables the configuration of a device and its role in the power system to be precisely defined using XML files.
Major Benefits
The features described above for IEC 61850 deliver substantial benefits to users that understand and take advantage of them. Rather than simply approaching an IEC 61850 based system in the same way as any other system, a user that understands and takes advantage of the unique capabilities will realize significant benefits that are not available using legacy approaches.
- Eliminate Procurement Ambiguity. Not only can SCL be used to configure devices and power systems, SCL can also be used to precisely define user requirement for substations and devices. Using SCL a user can specify exactly and unambiguously what is expected to be provided in each device that is not subject to misinterpretation by suppliers.
- Lower Installation Cost. IEC 61850 enables devices to quickly exchange data and status using GOOSE and GSSE over the station LAN without having to wire separate links for each relay. This significantly reduces wiring costs by more fully utilizing the station LAN bandwidth for these signals and construction costs by reducing the need for trenching, ducts, conduit, etc.
- Lower Transducer Costs. Rather than requiring separate transducers for each device needing a particular signal, a single merging unit supporting SMV can deliver these signals to many devices using a single transducer lowering transducer, wiring, calibration, and maintenance costs.
- Lower Commissioning Costs. The cost to configure and commission devices is drastically reduced because IEC 61850 devices don’t require as much manual configuration as legacy devices. Client applications no longer need to manually configured for each point they need to access because they can retrieve the points list directly from the device or import it via an SCL file. Many applications require nothing more than setting up a network address in order to establish communications. Most manual configuration is eliminated drastically reducing errors and rework.
- Lower Equipment Migration Costs. Because IEC 61850 defines more of the externally visible aspects of the devices besides just the encoding of data on the wire, the cost for equipment migrations is minimized. Behavioral differences from one brand of device to another is minimized and, in some cases, completely eliminated. All devices share the same naming conventions minimizing the reconfiguration of client applications when those devices are changed.
- Lower Extension Costs. Because IEC 61850 devices don’t have to be configured to expose data, new extensions are easily added into the substation without having to reconfigure devices to expose data that was previously not accessed. Adding devices and applications into an existing IEC 61850 system can be done with only a minimal impact, if any, on any of the existing equipment.
- Lower Integration Costs. By utilizing the same networking technology that is being widely used across the utility enterprise the cost to integrate substation data into the enterprise is substantially reduced. Rather than installing costly RTUs that have to be manually configured and maintained for each point of data needed in control center and engineering office application, IEC 61850 networks are capable of delivering data without separate communications front-ends or reconfiguring devices.
- Implement New Capabilities. The advanced services and unique features of IEC 61850 enables new capabilities that are simply not possible with most legacy protocols. Wide area protection schemes that would normally be cost prohibitive become much more feasible. Because devices are already connected to the substation LAN, the incremental cost for accessing or sharing more device data becomes insignificant enabling new and innovative applications that would be too costly to produce otherwise.
Conclusions
IEC 61850 is now released to the industry. Ten parts of the standard are now International Standards (part 10 is a draft international standard). This standard addresses most of the issues that migration to the digital world entails, especially, standardization of data names, creation of a comprehensive set of services, implementation over standard protocols and hardware, and definition of a process bus.
Multi-vendor interoperability has been demonstrated and compliance certification processes are being established. Discussions are underway to utilize IEC 61850 as the substation to control center communication protocol. IEC 61850 will become the protocol of choice as utilities migrate to network solutions for the substations and beyond.
SOURCE: Ralph Mackiewicz SISCO, Inc. Sterling Heights, MI USA
.
Related articles
- IEC 61850 Standard In Details (1)
- Testing performances of IEC 61850 GOOSE messages
- IEC 61850 Standard In Details (2)
- Testiranje performansi IEC 61850 GOOSE poruka
- The New ETS4: Easy, Fast, Open
1,959 views

Reduction In The Cost Of Electricity
Good management in the consumption of reactive energy brings with it the following economic advantages.
These notes are based on an actual tariff structure of a kind commonly applied in Europe, designed to encourage consumers to minimize their consumption of reactive energy.
The installation of power-factor correcting capacitors on installations permits the consumer to reduce his electricity bill by maintaining the level of reactive-power consumption below a value contractually agreed with the power supply authority.
In this particular tariff, reactive energy is billed according to the tan ϕ criterion.
As previously noted:
![]()
At the supply service position, the power supply distributor delivers reactive energy free, until:
- The point at which it reaches 40% of the active energy (tan ϕ = 0.4) for a maximum period of 16 hours each day (from 06-00 h to 22-00 h) during the mostheavily loaded period (often in winter)
- Without limitation during light-load periods in winter, and in spring and summer.
During the periods of limitation, reactive energy consumption exceeding 40% of the active energy (i.e. tan ϕ > 0.4) is billed monthly at the current rates. Thus, the quantity of reactive energy billed in these periods will be:
kvarh (to be billed) = kWh (tan ϕ – 0.4) where kWh is the active energy consumed during the periods of limitation, and kWh tan ϕ is the total reactive energy during a period of limitation, and 0.4 kWh is the amount of reactive energy delivered free during a period of limitation.
Tan ϕ = 0.4 corresponds to a power factor of 0.93 so that, if steps are taken to ensure that during the limitation periods the power factor never falls below 0.93, the consumer will have nothing to pay for the reactive power consumed.
Against the financial advantages of reduced billing, the consumer must balance the cost of purchasing, installing and maintaining the power-factor-improvement capacitors and controlling switchgear, automatic control equipment (where stepped levels of compensation are required) together with the additional kWh consumed by the dielectric.
Losses of the capacitors, etc. It may be found that it is more economic to provide partial compensation only, and that paying for some of the reactive energy consumed is less expensive than providing 100% compensation.
The question of power-factor correction is a matter of optimization, except in very simple cases.
Technical/economic optimization
A high power factor allows the optimization of the components of an installation. Overating of certain equipment can be avoided, but to achieve the best results, the correction should be effected as close to the individual items of inductive plant as possible.
Reduction of cable size
Figure 1 shows the required increase in the size of cables as the power factor is reduced from unity to 0.4.

Fig. 1 : Multiplying factor for cable size as a function of cos φ
.
Related articles
- Superconducting transformers
- General about motors
- Corona ions (air ionisation)
- The Power Factor
- Wind Power Applications
2,078 views

The Nature Of Reactive Energy
All inductive machines i.e. electromagnetic and devices that operate on AC systems convert electrical energy from the powersystem generators into mechanical work and heat. This energy is measured by kWh meters, and is referred to as active or wattful energy. In order to perform this conversion, magnetic fields have to be established in the machines, and these fields are associated with another form of energy to be supplied from the power system, known as reactive or wattless energy.
The reason for this is that inductive plant cyclically absorbs energy from the system (during the build-up of the magnetic fields) and re-injects that energy into the system (during the collapse of the magnetic fields) twice in every power-frequency cycle.
The effect on generator rotors is to (tend to) slow them during one part of the cycle and to accelerate them during another part of the cycle. The pulsating torque is stricly true only for single-phase alternators. In three-phase alternators the effect is mutually cancelled in the three phases, since, at any instant, the reactive energy supplied on one (or two) phase(s) is equal to the reactive energy being returned on the other two (or one) phase(s) of a balanced system. The nett result is zero average load on the generators, i.e. the reactive current is “wattless”.
An exactly similar phenomenon occurs with shunt capacitive elements in a power system, such as cable capacitance or banks of power capacitors, etc. In this case, energy is stored electrostatically. The cyclic charging and discharging of capacitive plant reacts on the generators of the system in the same manner as that described above for inductive plant, but the current flow to and from capacitive plant is in exact phase opposition to that of the inductive plant. This feature is the basis on which powerfactor improvement schemes depend.
It should be noted that while this “wattless” current (more accurately, the wattless component of a load current) does not draw power from the system, it does cause power losses in transmission and distribution systems by heating the conductors.
In practical power systems, wattless components of load currents are invariably inductive, while the impedances of transmission and distribution systems are predominantly inductively reactive. The combination of inductive current passing through an inductive reactance produces the worst possible conditions of voltage drop (i.e. in direct phase opposition to the system voltage).

Fig. 1 : An electric motor requires active power P and reactive power Q from the power system
For these reasons, viz:
- Transmission power losses and
- Voltage drop
The power-supply authorities reduce the amount of wattless (inductive) current as much as possible. Wattless (capacitive) currents have the reverse effect on voltage levels and produce voltage-rises in power systems.
The power (kW) associated with “active” energy is usually represented by the letter P. The reactive power (kvar) is represented by Q. Inductively-reactive power is conventionally positive (+ Q) while capacitively-reactive power is shown as a negative quantity (- Q). S represents kVA of “apparent” power.
Figure 1 shows that the kVA of apparent power is the vector sum of the kW of active power plus the kvar of reactive power.
Alternating current systems supply two forms of energy:
- Active energy measured in kilowatt hours (kWh) which is converted into mechanical work, heat, light, etc
- Reactive energy, which again takes two forms:
- “Reactive” energy required by inductive circuits (transformers, motors, etc.),
Plant and appliances requiring reactive energy
All AC plant and appliances that include electromagnetic devices, or depend on magnetically-coupled windings, require some degree of reactive current to create magnetic flux. The most common items in this class are transformers and reactors, motors and discharge lamps (i.e. the ballasts of).
The proportion of reactive power (kvar) with respect to active power (kW) when an item of plant is fully loaded varies according to the item concerned being:
- 65-75% for asynchronous motors
- 5-10% for transformers
SOURCE: Schneider Electric
.
Related articles
- What is PowerLogic System?
- Substation, Its Function And Types
- The Power Factor
- Hydropower In Details
- Cost benefits of AC drives
22,468 views

Standard IEC 60947-2 | Circuit Breakers
This standard applies to circuit-breakers, the main contacts of which are intended to be connected to circuits, the rated voltage of which does not exceed 1000 VAC or 1500 VDC.; it also contains additional requirements for integrally fused circuit-breakers.
It applies whatever the rated currents, the method of construction or the proposed applications of the circuit-breakers may be.
Changes in dependability needs and technologies have led to a marked increase in standard requirements for industrial circuit-breakers.
Conformity with standard IEC 947-2, renamed IEC 60947-2 in 1997, can be considered as an ‘all-risk’ insurance for use of circuit-breakers. This standard has been approved by all countries.
The principles
Standard IEC 60947-2 is part of a series of standards defining the specifications for LV electrical switchgear:
- the general rules IEC 60947-1, that group the definitions, specifications and tests common to all LV industrial switchgear.
- the product standards IEC 60947-2 to 7, that deal with specifications and tests specific to the product concerned. Standard IEC 60947-2 applies to circuit-breakers and their associated trip units. Circuit-breaker operating data depend on the trip units or relays that control their opening in specific conditions.
This standard defines the main data of industrial circuit-breakers:
- their classification: utilisation category, suitability for isolation, etc.
- the electrical setting data
- the information useful for operation
- the design measures
- coordination of protection devices
The standard also draws up series of conformity tests to be undergone by the circuitbreakers. These tests, which are very complete, are very close to real operating conditions. Conformity of these tests with standard IEC 60947-2 is verified by accredited laboratories.
Table of main data (appendix K IEC 60947-2):
")
Circuit-breaker category
Category IEC 60947-2 defines two circuit-breaker categories:
- category A circuit-breakers, for which no tripping delay is provided. This is normally the case of moulded case circuit-breakers. These circuit-breakers can provide current discrimination.
- category B circuit-breakers, for which, in order to provide time discrimination, tripping can be delayed (up to 1 s) for all short-circuits of value less than the current Icw.
This is normally the case of power or moulded case circuit-breakers with high ratings. For circuit-breakers installed in the MSBs, it is important to have an lcw equal to lcu in order to naturally provide discrimination up to full ultimate breaking capacity Icu.
Reminders of standard-related electrical data
The setting data are given by the tripping curves. These curves contain some areas limited by the following currents.

- Rated operational current (In)
In (in A rms) = maximum uninterrupted current withstood at a given ambient temperature without abnormal temperature rise.
E.g. 125 A at 40 °C - Adjustable overload setting current (lr)
Ir (in A rms) is a function of ln. lr characterises overload protection. For operation in overload, the conventional non-tripping currents lnd and tripping currents ld are:- Ind = 1.05 Ir
- Id = 1.30 Ir
Id is given for a conventional tripping time. For a current greater than ld, tripping by thermal effect will take place according to an inverse time curve. Ir is known as Long Time Protection (LTP).
Short time tripping setting current (Isd)
Isd (in kA rms) is a function of Ir. lsd characterises short-circuit protection. The circuit breaker opens according to the short time tripping curve:- either with a time delay tsd,
- or with constant I2t,
- or instantaneously (similar to instantaneous protection).
Isd is known as Short Time Protection or lm.
- Instantaneous tripping setting current (Ii)
Ii (in kA) is given as a function of ln. It characterises the instantaneous short-circuit protection for all circuit-breaker categories. For high overcurrents (short-circuits) greater than the li threshold, the circuit-breaker must immediately break the fault current.
.
This protection device can be disabled according to the technology and type of circuit-breaker (particularly B category circuit-breakers).

Table for calculation of asymmetrical short-circuits (IEC 60947.2 para. 4.3.5.3.)

- Rated short-circuit making capacity(*) (Icm)
Icm (peak kA) is the maximum value of the asymmetrical short-circuit current that the circuit-breaker can make and break. For a circuit-breaker, the stress to be managed is greatest on closing on a short-circuit. - Rated ultimate breaking capacity(*) (Icu)
Icu (kA rms) is the maximum short-circuit current value that the circuit-breaker can break. It is verified according to a sequence of standardised tests. After this sequence, the circuit-breaker must not be dangerous. This characteristic is defined for a specific voltage rating Ue. - Rated service breaking capacity(*) (Ics)
Ics (kA rms) is given by the manufacturer and is expressed as a % of Icu. This performance is very important as it gives the ability of a circuit-breaker to provide totally normal operation once it has broken this short-circuit current three times. The higher Ics, the more effective the circuit-breaker. - Rated short time withstand current(*) (Icw)
Defined for B category circuit-breakers
Icw (kA rms) is the maximum short-circuit current that the circuit-breaker can withstand for a short period of time (0.05 to 1 s) without its properties being affected. This performance is verified during the standardised test sequence.
.
(*) These data are defined for a specific voltage rating Ue.
Circuit-breaker coordination
The term coordination concerns the behaviour of two devices placed in series in electrical power distribution in the presence of a short-circuit.

- Cascading or back-up protection
This consists of installing an upstream circuit-breaker D1 to help a downstream circuit-breaker D2 to break short-circuit currents greater than its ultimate breaking capacity IcuD2. This value is marked IcuD2+D1.
IEC 60947-2 recognises cascading between two circuit-breakers. For critical points, where tripping curves overlap, cascading must be verified by tests. - Discrimination
This consists of providing coordination between the operating characteristics of circuit-breakers placed in series so that should a downstream fault occur, only the circuit-breaker placed immediately upstream of the fault will trip.
IEC 60947-2 defines a current value ls known as the discrimination limit such that:- if the fault current is less than this value ls, only the downstream circuit-breaker D2 trips,
- if the fault current is greater than this value ls, both circuit-breakers D1 and D2 trip.
Just as for cascading, discrimination must be verified by tests for critical points.
Discrimination and cascading can only be guaranteed by the manufacturer who will record his tests in tables.
IEC 60947-2 Summary
Standard IEC 60947.2 specifies the main data of Industrial Circuit-Breakers:
- the utilisation category
- the setting data
- the design measures
- etc.
It draws up a series of very complete tests representative of circuit-breaker real operating conditions.
SOURCE: Schneider Electric
.
Related articles
- Siemens MV Topic – Loss Of Vacuum
- Maintenance Of Molded Case Circuit Breakers (MCCB)
- Short Circuit Parameters in Low Voltage AC Circuits
- Cascading
- ABB launches new generation 420kV gas insulated switchgear
20,126 views

An Example Of KNX Project Design
It is basically possible to design a residential building according to criteria similar to those of a functional building and with that to plan the same functionality. The building installations usually seen up to now have for years been based on the distribution and switching of electrical energy. This method is long outdated. Private clients still tend to derive their requirements and expectations regarding electrical installations from their experiences with familiar installation technology.
But in terms of:
- comfort
- possibilities for flexible room usage
- centralised and decentralised controls
- security
- the intelligent linking of systems across different building disciplines
- communication possibilities
- environmental considerations as well as
- a reduction in the energy and operating costs,
modern installations have changed dramatically.
During a consultation, the private client is largely unaware of the range of possibilities and opportunities for future extension that are offered by an EIB installation. This information must be passed onto him as clearly as possible without overloading him with unnecessary details. He must be told that it is easily possible to expand or complete his EIB installation at a later date. Good and comprehensive consultation is the best foundation for follow-on contracts for the completion and extension of carefully planned EIB systems.
Incomplete or inadequate consultation can quickly turn an initially satisfied customer into a very unsatisfied customer, if he later learns that his investment in a bus installation cannot be fully exploited. It must be made clear however, that the answers themselves do not define the installation. They only serve to analyse the customer’s requirements as a basis for determining the feasibility.
Some of the questions hint at technical solutions that will only be available on the market in the months or years to come. They do however play a role in the suggested solutions, as it is possible to take them into consideration for implementation at a later date (preparatory cabling). Completion of this questionnaire essentially represents the specifications. An offer can then be made on the basis of this document, using the “ZVEH calculation aid”. Project design begins once the contract is awarded.

Fig.1 - KNX Project
Writing the specifications based on a given example
The answers marked in the questionnaire yield the following basic requirements on the EIB project:
- The private customer is building a one-family house with garden and garage on a remote site.
- There are distinct demands on security.
- Value is placed on ways to save energy and costs.
- Particular demands have been made regarding comfort.
- Some of the wishes cannot yet be technically realised, which means that a system planned with foresight is extremely important for follow-on contracts.
- Subsequent extensions to the system and functionality must be taken into consideration.
- A few of the possibilities mentioned in the questionnaire are viewed as critical; further information and more detailed explanations could extend the project and offer approaches to a service contract.
The system requirements essentially comprise the following:
Lighting
- Within the house, switching points should be located near the doors as well as in the sleeping and seating areas.
- Lighting control with movement detectors should also be planned for the garden and access paths.
- Security lighting should be incorporated.
- The simulation of an “occupied house” by adjustable sequences is required.
- The lighting control should be integrated into the Home-Assistant.
Sockets
- Switchable sockets should be provided for the exterior areas, kitchen, workroom and bedrooms.
- Sockets must have child-protection.
- For the simulation of an “occupied house”, switchable sockets should be planned for lights.
- The switching status of the sockets should be represented in the HomeAssistant.
Room heating
- Single room temperature control should be included, which in addition to manual intervention also allows monitoring and control via a HomeAssistant.
- The radiators should be switched off when the windows are open.
- Remote control and remote signalling should be possible for the heating system.
- Reporting to a customer services department should be planned for a later date.
Heating system
- The heating system should be adapted to the requirements in a way that saves energy and costs. It should also be possible to monitor it from a central position; i.e. it should be connected to the EIB and integrated into the HomeAssistant.
Hot water supply
- The hot water supply should be investigated separately, as a combination of gas, electricity and perhaps at a later date solar energy must be taken into account.
Blinds and shutters
- The blinds should be motorised and must react accordingly in adverse weather conditions.
- In addition to manual operating possibilities located near to the windows, it should also be possible to control and monitor them from a central position.
- In rooms subject to dazzling sunlight, it should also be possible to adjust the angle of the slats.
- The open or closed status should be centrally displayed.
- They should be incorporated into a security system.
Awnings
- In addition to manual operating possibilities, awnings installed on the patio should be automatically retracted in strong wind or rain. It should also be possible to use them to influence the temperature of the shaded room.
- They should also be used to simulate an “occupied house” and allow the possibility of control from a central position.
Window monitoring
- The closed status of the windows should be monitored and displayed centrally.
- Any tampering should be detected and incorporated into a security system.
- Motor-driven operation should be included as a possibility for use at a later date.
Door and gate monitoring
- The closed status of the house doors and garden gates is to be incorporated into a security system. Additional visual monitoring is also desired.
Monitoring the supply lines
- For extra safety, the water and gas supplies should be monitored and integrated into a security system. As this is not yet on the market, a provisional installation must be planned.
Meter monitoring
- As a prerequisite for measures to save energy and costs, the meter readings and running costs should be displayed. The installation should be designed for the future implementation of remote meter reading.
House appliances
- Regarding new purchases, interest lies in the use of devices with a bus connection. It is therefore necessary to plan, at least provisionally, the corresponding number of communication sockets.
Garden system
- In the garden and along the path to the house there should be lighting and movement detectors and these should be integrated into a general security system.
- It should be possible to operate a sprinkler system depending on the dampness of the ground.
Security equipment
- Measures should be included to increase security. This must include interior and exterior lighting, the windows, blinds and the entrance doors.
- Monitoring at the HomeAssistant with remote signalling possibilities should be planned.
- It should be possible to trigger emergency and help calls, quickly and easily.
Central operating and control unit
- A device, which is capable of receiving television signals in addition to allowing the simple operation and control of the household installations, should be fitted in the kitchen (HomeAssistant).
Extras
There is also interest in the following extensions, planned for the future:
- Cultivation of a winter garden with shadowing and utilisation of the heat energy that is produced in the transitional period.
- Lighting in the living area.
- Isolation of the bedrooms to avoid electromagnetic fields.
- Connection to service stations for the various devices.
- Construction of a garden pond with the ability to monitor the circulating pump and maintain a constant level.
- Installation of a solar panel and integration into the existing hot water supply.
An example of designing a project
Although in comparison with a large functional building, we are dealing with a much clearer installation here, a installation should be planned. This has as much to do with the variety of functions desired as well as with the high probability of later expansion. A separate line should be provided for each floor to ensure simple and clear structuring. Because this example deals with a new project, the project design is carried out with ETS 3. The result is an extensive set of detailed lists. For projects where there is a high probability of expansion or modification within subsequent years, other documents should be provided in addition to the lists.
Results of the project design stage form the foundation for all subsequent steps of the installation, commissioning and maintenance, and with that of course for all future expansion. Reference is made to the documents or wiring diagrams in accordance with the standards of the EN 61082 or DIN 40719 series, in particular to the bus devices and bus lines with physical and group addresses that are marked on the ground plan (see Fig. 1). The logic diagram indicates the bus devices and their physical addresses as well as allocation to the lines. If the complexity of the project demands, it may also be necessary to draw up a functional diagram. This saves a considerable amount of time during subsequent expansions or modifications.
If you also draw the parameter block for each of the bus devices, you are left with an excellent and very clear set of documents. The HomeAssistant necessary to implement this example system demands exact adherence to the rules of ETS 3 and to the design guidelines. Of particular importance is the entry of room structure, completion of the key fields and the addition of extra groups (so-called single actuator groups).
Adherence to these guidelines is important because the terms and names for the rooms and devices are derived from this data and appear in the operating menus of the HomeAssistant, allowing the end user to recognise his own individual system. The database created with ETS 3 is transferred into the HomeAssistant using the HomeAssistant Tool Software (HTS), which is included in the scope of supply.
SOURCE: Project Engineering for EIB Installations
.
Related articles
- ePlusMenuCAD 10 RC1 – New Release
- The New ETS4: Easy, Fast, Open
- LIGHTING FUNDAMENTALS
- ABB i-bus KNX – Constant lighting control
- Transformer heating and cooling
3,441 views

Cost benefits of AC drives
In addition to their technical advantages, AC drives also provide many cost benefits. In this chapter, these benefits are reviewed, with the costs divided into investment, installation and opera- tional costs.
At the moment there are still plenty of motors sold without variable speed AC drives. This pie chart shows how many motors below 2.2 kW are sold with frequency converters, and how many without. Only 3% of motors in this power range are sold each year with a frequency converter; 97% are sold without an AC drive.
This is astonishing considering what we have seen so far in this guide. Even more so after closer study of the costs of an AC drive compared to conventional control methods. But first let’s review AC drive technology compared to other control methods.

How many motors below 2.2 kW are sold with and without frequency converters
.
Technical differences between other systems and AC drives
AC drive technology is completely different from other, simpler control methods. It can be compared, for example, to the dif- ference between a zeppelin and a modern airplane.
We could also compare AC drive technology to the develop- ment from a floppy disk to a CD-ROM. Although it is a simpler information storage method, a floppy disk can only handle a small fraction of the information that a CD-ROM can.
The benefits of both these innovations are generally well known. Similarly, AC drive technology is based on a totally different technology to earlier control methods. In this guide, we have presented the benefits of the AC drive compared to simpler control methods.

Technical differences between other systems and AC drives
.
No mechanical control parts needed
To make a proper cost comparison, we need to study the configurations of different control methods. Here we have used pumping as an example. In traditional methods, there is always a mechanical part and an electrical part.
In throttling you need fuses, contactors and reactors on the electrical side and valves on the mechanical side. In On/Off control, the same electrical components are needed, as well as a pressure tank on the mechanical side. The AC drive provides a new solution. No mechanics are needed, because all control is already on the electrical side.
Another benefit, when thinking about cost, is that with an AC drive we can use a regular 3-phase motor, which is much cheaper than the single phase motors used in other control methods. We can still use 220 V single phase supply, when speaking of power below 2.2 kW.
| Conventional methods: | AC drive: |
| • Both electrical and mechanical parts | • All in one |
| • Many electrical parts | • Only one electrical component |
| • Mechanical parts need regular maintenance | • No mechanical parts, no wear and tear |
| • Mechanical control is energy consuming | • Saves energy |
.
Factors affecting cost
This list compares the features of conventional control methods with those of the AC drive, as well as their effect on costs. In conventional methods there are both electrical and mechanical components, which usually have to be purchased separately. The costs are usually higher than if everything could be pur- chased at once. Furthermore, mechanical parts wear out quickly. This directly affects maintenance costs and in the long run, maintenance is a very important cost item. In conventional methods there are also many electrical components. The installation cost is at least doubled when there are several different types of components rather than only one.
And last but not least, mechanical control is very energy con- suming, while AC drives practically save energy. This not only helps reduce costs, but also helps minimise environmental impact by reducing emissions from power plants.
.
Investment costs: Mechanical and electrical components

Price Comparison For Pumps
In this graph, the investment structure as well as the total price of each pump control method is presented. Only the pump itself is not added to the costs because its price is the same regardless of whether it’s used with an AC drive or valves. In throttling, there are two possibilities depending on whether the pump is used in industrial or domestic use. In an industrial environment there are stricter requirements for valves and this increases costs.
.
The motor
As can be seen, the motor is much more expensive for traditional control methods than for the AC drive. This is due to the 3-phase motor used with the AC drive and the single phase motor used in other control methods.
.
.
The AC drive
The AC drive does not need any mechanical parts, which reduc- es costs dramatically. Mechanical parts themselves are almost always less costly than a frequency converter, but electrical parts also need to be added to the total investment cost.
After taking all costs into account, an AC drive is almost always the most economical investment, when compared to differ- ent control methods. Only throttling in domestic use is as low cost as the AC drive. These are not the total costs, however. Together with investment costs we need to look at installation and operational costs.
| Throttling | AC drive | |
| Installation material | 20 USD | 10 USD |
| Installation work | 5h x 65 USD = 325 USD | 1h x 65 USD = 65 USD |
| Commissioning work | 1h x 65 USD = 65 USD | 1h x 65 USD = 65 USD |
| TOTAL: | 410 USD | 140 USD |
| Savings in installation: 270 USD! | ||
.
Installation costs: Throttling compared to AC drive
Because throttling is the second lowest investment after the AC drive, we will compare its installation and operating costs to the cost of the AC drive. As mentioned earlier, in throttling there are both electrical and mechanical components. This means twice the amount of installation material is needed.
Installation work is also at least doubled in throttling compared to the AC drive. To install a mechanical valve into a pipe is not that simple and this increases installation time. To have a mechanical valve ready for use usually requires five hours compared to one hour for the AC drive. Multiply this by the hourly rate charged by a skilled installer to get the total installation cost.
The commissioning of a throttling-based system does not usu- ally require more time than commissioning an AC drive based system. One hour is usually the time required in both cases. So now we can summarise the total installation costs. As you can see, the AC drive saves up to USD 270 per installation. So even if the throttling investment costs were lower than the price of a single phase motor (approximately USD 200), the AC drive would pay for itself before it has even worked a second.
| Throttling | AC drive | |
| Power required | 0.75 kW | 0.37 kW |
| Annual energy 4000 hours/year | 3000 kWh | 1500 kWh |
| Annual energy cost with 0.1 USD/kWh | 300 USD | 150 USD |
| Maintenance/year | 40 USD | 5 USD |
| TOTAL COST/YEAR: | 340 USD | 155 USD |
| Savings in installation: 185 USD! | ||
.
Operational costs: Maintenance and drive energy
In many surveys and experiments it has been proved that a 50% energy saving is easily achieved with an AC drive. This means that where power requirements with throttling would be 0.75 kW, with the AC drive it would be 0.37 kW. If a pump is used 4000 hours per year, throttling would need 3000 kWh and the AC drive 1500 kWh of energy per year.
To calculate the savings, we need to multiply the energy con- sumption by the energy price, which varies depending on the country. Here USD 0.1 per kWh has been used.
As mentioned earlier, mechanical parts wear a lot and this is why they need regular maintenance. It has been estimated that whereas throttling requires USD 40 per year for service, maintenance costs for an AC drive would be USD 5. In many cases however, there is no maintenance required for a frequency converter.
Therefore, the total savings in operating costs would be USD 185, which is approximately half of the frequency convert- er’s price for this power range. This means that the payback time of the frequency converter is two years. So it is worth considering that instead of yearly service for an old valve it might be more profitable to change the whole system to an AC drive based control. To retrofit an existing throttling system the pay-back time is two years.
.
Total cost comparison

Total Savings Over 10 Year - USD 1562
In the above figure, all the costs have been summarised. The usual time for an operational cost calculation for this kind of investment is 10 years. Here the operational costs are rated to the present value with a 10% interest rate.
In the long run, the conventional method will be more than twice as expensive as a frequency converter. Most of the savings with the AC drive come from the operational costs, and especially from the energy savings. It is in the installation that the high- est individual savings can be achieved, and these savings are realised as soon as the drive is installed.
Taking the total cost figure into account, it is very difficult to understand why only 3% of motors sold have a frequency con- verter. In this guide we have tried to present the benefits of the AC drive and why we at ABB think that it is absolutely the best possible way to control your process.
SOURCE: ABB Drives
.
Related articles
- The Benefits of VFDs In HVAC Systems
- General about motors
- The Best Applications For VFDs
- Nove e-knjige – ABB Technical Guides
- ABB launches new generation 420kV gas insulated switchgear
38,289 views

Wind Power Applications
The wind is a free, clean, and inexhaustible energy source. It has served humankind well for many centuries by propelling ships and driving wind turbines to grind grain and pump water. Denmark was the first country to use wind for generation of electricity. The Danes were using a 23-m diameter wind turbine in 1890 to generate electricity. By 1910, several hundred units with capacities of 5 to 25 kW were in operation in Denmark (Johnson, 1985). By about 1925, commercial wind-electric plants using two- and three-bladed propellers appeared on the American market. The most common brands were Win- charger (200 to 1200 W) and Jacobs (1.5 to 3 kW). These were used on farms to charge storage batteries which were then used to operate radios, lights, and small appliances with voltage ratings of 12, 32, or 110 volts. A good selection of 32-VDC appliances was developed by the industry to meet this demand.
In addition to home wind-electric generation, a number of utilities around the world have built larger wind turbines to supply power to their customers. The largest wind turbine built before the late 1970s was a 1250-kW machine built on Grandpa’s Knob, near Rutland, Vermont, in 1941. This turbine, called the Smith-Putnam machine, had a tower that was 34 m high and a rotor 53 m in diameter. The rotor turned an ac synchronous generator that produced 1250 kW of electrical power at wind speeds above 13 m/s.
After World War II, we entered the era of cheap oil imported from the Middle East. Interest in wind energy died and companies making small turbines folded. The oil embargo of 1973 served as a wakeup call, and oil-importing nations around the world started looking at wind again. The two most important countries in wind power development since then have been the U.S. and Denmark (Brower et al., 1993).
The U.S. immediately started to develop utility-scale turbines. It was understood that large turbines had the potential for producing cheaper electricity than smaller turbines, so that was a reasonable decision. The strategy of getting large turbines in place was poorly chosen, however. The Department of Energy decided that only large aerospace companies had the manufacturing and engineering capability to build utility-scale turbines. This meant that small companies with good ideas would not have the revenue stream necessary for survival. The problem with the aerospace firms was that they had no desire to manufacture utility-scale wind turbines. They gladly took the government’s money to build test turbines, but when the money ran out, they were looking for other research projects. The government funded a number of test turbines, from the 100 kW MOD-0 to the 2500 kW MOD-2. These ran for brief periods of time, a few years at most. Once it was obvious that a particular design would never be cost competitive, the turbine was quickly salvaged.
Denmark, on the other hand, established a plan whereby a landowner could buy a turbine and sell the electricity to the local utility at a price where there was at least some hope of making money. The early turbines were larger than what a farmer would need for himself, but not what we would consider utility scale. This provided a revenue stream for small companies. They could try new ideas and learn from their mistakes. Many people jumped into this new market. In 1986, there were 25 wind turbine manufacturers in Denmark. The Danish market gave them a base from which they could also sell to other countries. It was said that Denmark led the world in exports of two products: wind turbines and butter cookies! There has been consolidation in the Danish industry since 1986, but some of the com- panies have grown large. Vestas, for example, has more installed wind turbine capacity worldwide than any other manufacturer.
Prices have dropped substantially since 1973, as performance has improved. It is now commonplace for wind power plants (collections of utility-scale turbines) to be able to sell electricity for under four cents per kilowatt hour.
Total installed worldwide capacity at the start of 1999 was almost 10,000 MW, according to the trade magazine Wind Power Monthly (1999). The countries with installed capacity until end of 2009 are shown in Table 1.
| # | Nation | 2005 | 2006 | 2007 | 2008 | 2009 |
|---|---|---|---|---|---|---|
| - | European Union | 40,722 | 48,122 | 56,614 | 65,255 | 74,767 |
| 1 | United States | 9,149 | 11,603 | 16,819 | 25,170 | 35,159 |
| 2 | Germany | 18,428 | 20,622 | 22,247 | 23,903 | 25,777 |
| 3 | China | 1,266 | 2,599 | 5,912 | 12,210 | 25,104 |
| 4 | Spain | 10,028 | 11,630 | 15,145 | 16,740 | 19,149 |
| 5 | India | 4,430 | 6,270 | 7,850 | 9,587 | 10,925 |
| 6 | Italy | 1,718 | 2,123 | 2,726 | 3,537 | 4,850 |
| 7 | France | 779 | 1,589 | 2,477 | 3,426 | 4,410 |
| 8 | United Kingdom | 1,353 | 1,963 | 2,389 | 3,288 | 4,070 |
| 9 | Portugal | 1,022 | 1,716 | 2,130 | 2,862 | 3,535 |
| 10 | Denmark | 3,132 | 3,140 | 3,129 | 3,164 | 3,465 |
| 11 | Canada | 683 | 1,460 | 1,846 | 2,369 | 3,319 |
| 12 | Netherlands | 1,236 | 1,571 | 1,759 | 2,237 | 2,229 |
| 13 | Japan | 1,040 | 1,309 | 1,528 | 1,880 | 2,056 |
| 14 | Australia | 579 | 817 | 817 | 1,494 | 1,712 |
| 15 | Sweden | 509 | 571 | 831 | 1,067 | 1,560 |
Applications
There are perhaps four distinct categories of wind power which should be discussed. These are:
- Small, non-grid connected
- Small, grid connected
- Large, non-grid connected
- Large, grid connected
By small, we mean a size appropriate for an individual to own, up to a few tens of kilowatts. Large refers to utility scale.
.
Small, Non-Grid Connected
If one wants electricity in a location not serviced by a utility, one of the options is a wind turbine, with batteries to level out supply and demand. This might be a vacation home, a remote antenna and transmitter site, or a Third-World village. The costs will be high, on the order of $0.50/kWh, but if the total energy usage is small, this might be acceptable. The alternatives, photovoltaics, microhydro, and diesel generators, are not cheap either, so a careful economic study needs to be done for each situation.
.
Small, Grid Connected
The small, grid connected turbine is usually not economically feasible. The cost of wind-generated elec- tricity is less because the utility is used for storage rather than a battery bank, but is still not competitive. In order for the small, grid connected turbine to have any hope of financial breakeven, the turbine owner needs to get something close to the retail price for the wind-generated electricity. One way this is done is for the owner to have an arrangement with the utility called net metering. With this system, the meter runs backward when the turbine is generating more than the owner is consuming at the moment. The owner pays a monthly charge for the wires to his home, but it is conceivable that the utility will sometimes write a check to the owner at the end of the month, rather than the other way around. The utilities do not like this arrangement. They want to buy at wholesale and sell at retail. They feel it is unfair to be used as a storage system without remuneration. For most of the twentieth century, utilities simply refused to connect the grid to wind turbines.
The utility had the right to generate electricity in a given service territory, and they would not tolerate competition. Then a law was passed that utilities had to hook up wind turbines and pay them the avoided cost for energy. Unless the state mandated net metering, the utility typically required the installation of a second meter, one measuring energy consumption by the home and the other energy production by the turbine. The owner would pay the regular retail rate, and the utility would pay their estimate of avoided cost, usually the fuel cost of some base load generator. The owner might pay $0.08 to $0.15 per kWh, and receive $0.02 per kWh for the wind-generated electricity. This was far from enough to eco- nomically justify a wind turbine, and had the effect of killing the small wind turbine business.
.
Large, Non-Grid Connected
These machines would be installed on islands or in native villages in the far north where it is virtually impossible to connect to a large grid. Such places are typically supplied by diesel generators, and have a substantial cost just for the imported fuel. One or more wind turbines would be installed in parallel with the diesel generators, and act as fuel savers when the wind was blowing.
This concept has been studied carefully and appears to be quite feasible technically. One would expect the market to develop after a few turbines have been shown to work for an extended period in hostile environments. It would be helpful if the diesel maintenance companies would also carry a line of wind turbines so the people in remote locations would not need to teach another group of maintenance people about the realities of life at places far away from the nearest hardware store.
.
Large, Grid Connected
We might ask if the utilities should be forced to buy wind-generated electricity from these small machines at a premium price which reflects their environmental value. Many have argued this over the years. A better question might be whether the small or the large turbines will result in a lower net cost to society. Given that we want the environmental benefits of wind generation, should we get the electricity from the wind with many thousands of individually owned small turbines, or should we use a much smaller number of utility-scale machines?
If we could make the argument that a dollar spent on wind turbines is a dollar not spent on hospitals, schools, and the like, then it follows that wind turbines should be as efficient as possible. Economies of scale and costs of operation and maintenance are such that the small, grid connected turbine will always need to receive substantially more per kilowatt hour than the utility-scale turbines in order to break even. There is obviously a niche market for turbines that are not connected to the grid, but small, grid connected turbines will probably not develop a thriving market. Most of the action will be from the utility-scale machines.
Sizes of these turbines have been increasing rapidly. Turbines with ratings near 1 MW are now common, with prototypes of 2 MW and more being tested. This is still small compared to the needs of a utility, so clusters of turbines are placed together to form wind power plants with total ratings of 10 to 100 MW.
SOURCE: Saifur Rahman Virginia Tech
.
Related articles
- Introduction To Micro Hydropower
- Corona ions (air ionisation)
- Reduction In The Cost Of Electricity
- The Unique Role Of Wind Turbine Step-Up (WTSU) Transformers
- Storage Systems
9,915 views

ABB Feeder Protection REF615 ANSI
The REF615 is powerful, most advanced and simplest feeder protection relay in its class, perfectly offering time and instantaneous overcurrent, negative sequence overcurrent, phase discontinuity, breaker failure and thermal overload protection. The relay also features optional high impedance fault (HIZ) and sensitive earth fault (SEF) protection for grounded and ungrounded distribution systems. Also, the relay incorporates a flexible three-phase multi-shot auto-reclose function for automatic feeder restoration in temporary faults on overhead lines. Enhanced with safety options, the relay offers a three-channel arc-fault detection system for supervision of the switchgear circuit breaker, cable and busbar compartments.
The REF615 also integrates basic control functionality, which facilitates the control of one circuit breaker via the relay’s front panel human machine interface (HMI) or remote control system. To protect the relay from unauthorized access and to maintain the integrity of information, the relay has been provided with a four-level, role-based user authentication system, with individual passwords for the viewer, operator, engineer and administrator level. The access control system applies to the front panel HMI, embedded web browser based HMI and the PCM600 relay setting and configuration tool.
Standardized communication
REF615 supports the new IEC 61850 standard for inter-device communication in substations. The relay also supports the industry standard DNP3.0 and Modbus® protocols.
The implementation of the IEC 61850 substation communication standard in REF615 encompasses both vertical and horizontal communication, including GOOSE messaging and parameter setting according to IEC 61850-8-1. The substation configuration language enables the use of engineering tools for automated configuration, commissioning and maintenance of substation devices.
Bus protection via GOOSE
The REF615 IEC 61850 implementation includes GOOSE messaging for fast horizontal relay-to-relay communication. Applying GOOSE communication to the REF615 relays of the incoming and outgoing feeders of a substation, a stable, reliable and high-speed bus protection system can be realized. The cost-effective GOOSE-based bus protection is obtained just by configuring the relays and the operational availability of the protection is assured by continuous supervision of the protection relays and their GOOSE messaging over the station communication network.
Costs are reduced since no separate physical input and output hard-wiring is needed for horizontal communication between the relays.

Bus protection via GOOSE
Pre-emptive condition monitoring
For continuous knowledge of the operational availability of the REF615 features, a comprehensive set of monitoring functions to supervise the relay health, the trip circuit and the circuit breaker health is included. The breaker monitoring can include checking the wear and tear of the circuit breaker, the spring charging time of the breaker operating mechanism and the gas pressure of the breaker chambers. The relay also monitors the breaker travel time and the number of circuit breaker (CB) operations to provide basic information for scheduling CB maintenance.
Rapid set-up and commissioning
Due to the ready-made adaptation of REF615 for the protection of feeders, the relay can be rapidly set up and commissioned, once it has been given the application- specific relay settings. If the relay needs to be adapted to the special requirements of the intended application, the flexibility of the relay allows the relay’s standard signal configuration to be adjusted by means of the signal matrix tool (SMT) included in its PCM600 relay setting and configuration user tool.
By means of Connectivity Packages containing complete descriptions of ABB’s protection relays, with data signals, parameters and addresses, the relays can be automatically configured via PCM600 relay setting and configuration user tool, COM600 Station Automation series devices, or MicroSCADA Pro substation automation system.
Unique draw-out design relay
The draw-out type relay design speeds up installation and testing of the protection. The factory-tested relay units can be withdrawn from the relay cases during factory and commissioning tests. The relay case provides automatic short-circuiting of the CT secondary circuits to prevent hazardous voltages from arising in the CT circuits when a relay plug-in unit is withdrawn from its case.
The pull-out handle locking the relay unit into its case can be sealed to prevent the unit from being unintentionally withdrawn from the relay case.
REF615 highlights
- Comprehensive overcurrent protection with high impedance fault, sensitive earth fault and thermal overload protection for feeder and dedicated protection schemes
- Simultaneous DN3.0 Level 2+ and Modbus Ethernet communications plus device connectivity and system interoperability according to the IEC 61850 standard for next generation substation communication
- Enhanced digital fault recorder functionality including high sampling frequency, extended length of records, 4 analog and 64 binary channels and flexible triggering possibilities
- High-speed, three-channel arc flash detection (AFD) for increased personal safety, reduced material damage and minimized system down-time
- Total control of the operational capability of the protection system through extensive condition monitoring of the relay and the associated primary equipment
- Draw-out type relay unit and a unique relay case design for a variety of mounting methods and fast installation, routine testing and maintenance
- One single tool for managing relay settings, signal configuration and disturbance handling
Analog inputs
- Three phase currents: 5/1 A
- Ground current: 5/1 A or 0.2 A
- Rated frequency: 60/50 Hz programmable
Binary inputs and outputs
- Four binary inputs with common ground
- Two NO double-pole outputs with TCM
- Two NO single-pole outputs
- One Form C signal output
- One Form C self-check alarm output
- Additional seven binary inputs plus three binary outputs (available as an option)
Communication
- IEC 61850-8-1 with GOOSE messaging
- DNP3.0 Level 2+ over TCP/IP
- Modbus over TCP/IP
- Time synchronization via SNTP (primary and backup servers)
- Optional serial RS-485 port programmable for DNP3.0 Level 2+ or Modbus RTU
Control voltage
- Option 1: 48 … 250 V dc, 100 … 240 V ac
- Option 2: 24 … 60 V dc
.
SOURCE: ABB
.
Related articles
- ANSI code 50BF – Breaker failure
- ANSI standards for protection devices
- Line Protection With Distance Relays
- Testing performances of IEC 61850 GOOSE messages
- Grounded or Ungrounded Systems

The Unique Role Of Wind Turbine WTSU
Harnessing wind energy to perform work is not a new concept. Since the earliest of times, wind power has been captured with sails to allow traders, merchants and explorers to ply their trades and discover the world around them. On land, windmills have been used for irrigation, grinding grains, and performing crude manufacturing for centuries. Even the generation of electricity from wind power is not a new idea. What is new, however, is the scale at which this renewable energy source is being used today.
Early wind generation served a local need, often supplying power for isolated equipment. Today, wind energy represents nearly 5% of the US electrical generation and is targeted to reach 20% in the foreseeable future.
For this to happen, wind turbine outputs need to be gathered, stepped-up to transmission levels and passed across the nation’s interconnected power grid to the end users. The role of the Wind Turbine Step-Up (WTSU) transformer in this process is critical and, as such, its design needs to be carefully and thoughtfully analyzed and reevaluated in our view.
Historically this WTSU transformer function has been handled by conventional, “off the shelf” distribution transformers, but the relatively large numbers of recent failures would strongly suggest that WTSU transformer designs need to be made substantially more robust. WTSU transformers are neither conventional “off the shelf” distribution transformers nor are they conventional “off the shelf” power generator step-up transformers. WTSU transformers fall somewhere in between and as such, we believe, require a unique design standard.
Although off-shore wind farms using dry-type transformers are beginning to grow in popularity, for this discussion we will look only at liquid-filled transformers that are normally associated with inland wind farm sites.
Transformer Loading
Wind turbine output voltages typically range from 480 volts to 690 volts. This turbine output is then delivered to the WTSU transformers and transformed to a collector voltage of 13,800 to 46,000 volts. The turbines are highly dependant upon local climatic conditions; and this dependency can result in yearly average load factor as low as 35%. Both conventional distribution transformers and power generator step-up transformers are typically subjected to more constant loading at, or slightly above, their theoretical maximum rating. This high level of loading stresses insulation thermally and leads to reduced insulation life. On the other hand, the relatively light loading of WTSU transformer has a favorable effect on insulation life but introduces two unique and functionally significant problems with which other types of conventional transformers do not have to deal.
The first problem is that, when lightly loaded or idle, the core losses become a more significant economic factor while the coil or winding losses become less significant and de-emphasized. Typically used price evaluation formulae do not apply to this scenario. NEMA TP1 and DOE efficiencies are not modeled for the operational scenario where average loading is near 30-35% and, consequently, should be cautiously applied when calculating the total cost of ownership for WTSU transformers.
The second problem is that the WTSU transformer goes into thermal cycling as a function of these varying loads. This causes repeated thermal stress on the winding, clamping structure, seals and gaskets. Repeated thermal cycling causes nitrogen gas to be absorbed into the hot oil and then released as the oil cools, forming bubbles within the oil which can migrate into the insulation and windings to create hot spots and partial discharges which can damage insulation. The thermal cycling can also cause accelerated aging of internal and external electrical connections.
These cumulative effects put the WTSU transformer at a higher risk of insulation and dielectric failure than either the typical “off the shelf” distribution transformer or the power generator step-up transformer experiences.
Harmonics and Non-Sinusoidal loads:
Another unique aspect of WTSU transformers is the fact that they are switched in the line with solid state controls to limit the inrush currents. This differs widely from the typical step-up transformer which must be designed to withstand high magnetizing inrush currents which cause core saturation, and in the extreme Ferroresonance.
While potentially aiding in the initial energization, these same electronic controls contribute damaging harmonic voltage frequencies that, when coupled with the non- sinusoidal wave forms from the wind turbines, cannot be ignored from a heating point of view. Conventional distribution transformers do not typically see non-linear loads that require preventative steps due to harmonic loading. When a rectifier/chopper system is used, the WTSU transformer must be designed for harmonics similar to rectifier transformers, taking the additional loading into consideration as well as providing electrostatic shields to prevent the transfer of harmonic frequencies between the primary and secondary windings, quite dissimilar to conventional distribution transformers.
Transformer sizing and voltage variation
WTSU transformers are designed such that the voltage is matched to the generator (e.g. wind turbine) output voltage exactly. There is no “designed in” over-voltage capacity to overcome voltage fluctuations, as is typically done on distribution and power transformer designs which allow for up to 10% over-voltage. Further, it should be noted that the generator output current is monitored at millisecond intervals and the generator limited to allow up to 5% over-current for 10 seconds before it is taken off the system. Therefore, the WTSU transformer size ( kVA or MVA) is designed to match the generator output with no overload sizing. Since overload sizing is a common protective practice with “off the shelf” distribution or power step-up generator transformers, the WTSU transformer design must be uniquely robust to function without it.
Requirement to withstand Fault Currents
Typically, conventional distribution transformers, power transformers, and other types of step-up transformers will “drop out” when subjected to an under-voltage or over- current situation caused by a fault. Once the fault has cleared, the distribution transformer is brought back on-line either individually or with it’s local feeder in conjunction with automatic reclosures. Wind turbine generators, on the other hand, in order to maintain network stability are only allowed to disconnect from the system due to network disturbances within certain, carefully controlled network guidelines developed for generating plants.
Depending upon the specific network regulations, the length of time the generator is required to stay on line can vary. During this time the generator will continue to deliver an abnormally low voltage to the WTSU transformer. Therefore, during near-to generator faults, the generator may be required to carry as low as 15% rated voltage for a few cycles and then ramp back up to full volts a few seconds after fault clearing. This means that the WTSU transformer must be uniquely designed with enough “ruggedness” to withstand full short circuit current during the initial few cycles when the maximum mechanical forces are exerted upon the WTSU transformer windings.
Since wind turbines must stay connected during disturbances in the network, the WTSU transformers must be designed to withstand the full mechanical effects of short circuits.
Conclusions
The role of WTSU transformers in today’s wind generation scheme is unique; it’s design must be equally unique and robust. The combination of wide variations in loading; harmonic loads from associated control electronics and generators; sizing without protection for over-voltages, under-voltages or over-loading; and the requirement to “ride through” transient events and faults sets the WTSU apart from it’s more conventional, “off the shelf” counterparts. It is neither a conventional distribution transformer nor is it a conventional generator step-up transformer.
“Off the shelf” . . . doesn’t belong . . . “down on the farm”!
.
AUTHOR: Pacific Crest Transformers
.
Related articles
- ABB Power Transformers – A guide to manufacturing
- Transformer Ratings
- Introduction To Micro Hydropower
- Substation, Its Function And Types
- Wind Power Applications
1,557 views

Storage Systems | ABB Battery
Energy storage technologies are of great interest to electric utilities, energy service companies, and automobile manufacturers (for electric vehicle application). The ability to store large amounts of energy would allow electric utilities to have greater flexibility in their operation because with this option the supply and demand do not have to be matched instantaneously. The availability of the proper battery at the right price will make the electric vehicle a reality, a goal that has eluded the automotive industry thus far. Four types of storage technologies (listed below) are discussed in this section, but most emphasis is placed on storage batteries because it is now closest to being commercially viable. The other storage technology widely used by the electric power industry, pumped-storage power plants, is not discussed as this has been in commercial operation for more than 60 years in various countries around the world.
- Flywheel storage
- Compressed air energy storage
- Superconducting magnetic energy storage
- Battery storage
Flywheel Storage
Flywheels store their energy in their rotating mass, which rotates at very high speeds (approaching 75,000 rotations per minute), and are made of composite materials instead of steel because of the composite’s ability to withstand the rotating forces exerted on the flywheel. In order to store enegy the flywheel is placed in a sealed container which is then placed in a vacuum to reduce air resistance. Magnets embedded in the flywheel pass near pickup coils. The magnet induces a current in the coil changing the rotational energy into electrical energy.
Flywheels are still in research and development, and commercial products are several years away.
Compressed Air Energy Storage
As the name implies, the compressed air energy storage (CAES) plant uses electricity to compress air which is stored in underground reservoirs. When electricity is needed, this compressed air is withdrawn, heated with gas or oil, and run through an expansion turbine to drive a generator. The compressed air can be stored in several types of underground structures, including caverns in salt or rock formations, aquifers, and depleted natural gas fields. Typically the compressed air in a CAES plant uses about one third of the premium fuel needed to produce the same amount of electricity as in a conventional plant. A 290-MW CAES plant has been in operation in Germany since the early 1980s with 90% availability and 99% starting reliability. In the U.S., the Alabama Electric Cooperative runs a CAES plant that stores compressed air in a 19-million cubic foot cavern mined from a salt dome. This 110-MW plant has a storage capacity of 26 h. The fixed-price turnkey cost for this first-of-a-kind plant is about $400/kW in constant 1988 dollars.
The turbomachinery of the CAES plant is like a combustion turbine, but the compressor and the expander operate independently. In a combustion turbine, the air that is used to drive the turbine is compressed just prior to combustion and expansion and, as a result, the compressor and the expander must operate at the same time and must have the same air mass flow rate. In the case of a CAES plant, the compressor and the expander can be sized independently to provide the utility-selected “optimal” MW charge and discharge rate which determines the ratio of hours of compression required for each hour of turbine-generator operation. The MW ratings and time ratio are influenced by the utility’s load curve, and the price of off-peak power.
For example, the CAES plant in Germany requires 4 h of compression per hour of generation. On the other hand, the Alabama plant requires 1.7 h of compression for each hour of generation. At 110-MW net output, the power ratio is 0.818 kW output for each kilowatt input. The heat rate (LHV) is 4122 BTU/kWh with natural gas fuel and 4089 BTU/kWh with fuel oil. Due to the storage option, a partial-load operation of the CAES plant is also very flexible. For example, the heat rate of the expander increases only by 5%, and the airflow decreases nearly linearly when the plant output is turned down to 45% of full load. However, CAES plants have not reached commercial viability beyond some prototypes.
Superconducting Magnetic Energy Storage
A third type of advanced energy storage technology is superconducting magnetic energy storage (SMES), which may someday allow electric utilities to store electricity with unparalled efficiency (90% or more). A simple description of SMES operation follows.
The electricity storage medium is a doughnut-shaped electromagnetic coil of superconducting wire. This coil could be about 1000 m in diameter, installed in a trench, and kept at superconducting temper- ature by a refrigeration system. Off-peak electricity, converted to direct current (DC), would be fed into this coil and stored for retrieval at any moment. The coil would be kept at a low-temperature supercon- ducting state using liquid helium.
The time between charging and discharging could be as little as 20 ms with a round-trip AC–AC efficiency of over 90%.
Developing a commercial-scale SMES plant presents both economic and technical challenges. Due to the high cost of liquiud helium, only plants with 1000-MW, 5-h capacity are economically attractive. Even then the plant capital cost can exceed several thousand dollars per kilowatt. As ceramic superconductors, which become superconducting at higher temperatures (maintained by less expensive liquid nitrogen), become more widely available, it may be possible to develop smaller scale SMES plants at a lower price.
Battery Storage
Even though battery storage is the oldest and most familiar energy storage device, significant advances have been made in this technology in recent years to deserve more attention. There has been renewed interest in this technology due to its potential application in non-polluting electric vehicles. Battery systems are quiet and non-polluting, and can be installed near load centers and existing suburban substations. These have round-trip AC–AC efficiencies in the range of 85%, and can respond to load changes within 20 ms. Several U.S., European, and Japanese utilities have demonstrated the application of lead–acid batteries for load-following applications. Some of them have been as large as 10 MW with 4 h of storage.
The other player in battery development is the automotive industry for electric vehicle application. In 1991, General Motors, Ford, Chrysler, Electric Power Research Institute (EPRI), several utilities, and the U.S. Department of Energy (DOE) formed the U.S. Advanced Battery Consortium (USABC) to develop better batteries for electric vehicle (EV) applications. A brief introduction to some of the available battery technologies as well some that are under study is presented in the following (Source:http://www.eren. doe.gov/consumerinfo/refbriefs/fa1/html).
Battery Types
Chemical batteries are individual cells filled with a conducting medium-electrolyte that, when connected together, form a battery. Multiple batteries connected together form a battery bank. At present, there are two main types of batteries: primary batteries (non-rechargeable) and secondary batteries (rechargeable). Secondary batteries are further divided into two categories based on the operating temperature of the electrolyte. Ambient operating temperature batteries have either aqueous (flooded) or nonaqueous elec- trolytes. High operating temperature batteries (molten electrodes) have either solid or molten electrolytes. Batteries in EVs are the secondary-rechargeable-type and are in either of the two sub-categories. A battery for an EV must meet certain performance goals.
These goals include quick discharge and recharge capability, long cycle life (the number of discharges before becoming unserviceable), low cost, recycla- bility, high specific energy (amount of usable energy, measured in watt-hours per pound [lb] or kilogram [kg]), high energy density (amount of energy stored per unit volume), specific power (determines the potential for acceleration), and the ability to work in extreme heat or cold. No battery currently available meets all these criteria.
Lead–Acid Batteries
Lead–acid starting batteries (shallow-cycle lead–acid secondary batteries) are the most common battery used in vehicles today. This battery is an ambient temperature, aqueous electrolyte battery. A cousin to this battery is the deep-cycle lead–acid battery, now widely used in golf carts and forklifts. The first electric cars built also used this technology. Although the lead–acid battery is relatively inexpensive, it is very heavy, with a limited usable energy by weight (specific energy). The battery’s low specific energy and poor energy density make for a very large and heavy battery pack, which cannot power a vehicle as far as an equivalent gas-powered vehicle. Lead–acid batteries should not be discharged by more than 80% of their rated capacity or depth of discharge (DOD). Exceeding the 80% DOD shortens the life of the battery. Lead–acid batteries are inexpensive, readily available, and are highly recyclable, using the elaborate recycling system already in place. Research continues to try to improve these batteries.
A lead–acid nonaqueous (gelled lead acid) battery uses an electrolyte paste instead of a liquid. These batteries do not have to be mounted in an upright position. There is no electrolyte to spill in an accident. Nonaqueous lead–acid batteries typically do not have as high a life cycle and are more expensive than flooded deep-cycle lead–acid batteries.
Nickel Iron and Nickel Cadmium Batteries
Nickel iron (Edison cells) and nickel cadmium (nicad) pocket and sintered plate batteries have been in use for many years. Both of these batteries have a specific energy of around 25 Wh/lb (55 Wh/kg), which is higher than advanced lead–acid batteries. These batteries also have a long cycle life. Both of these batteries are recyclable. Nickel iron batteries are non-toxic, while nicads are toxic. They can also be discharged to 100% DOD without damage. The biggest drawback to these batteries is their cost. Depend- ing on the size of battery bank in the vehicle, it may cost between $20,000 and $60,000 for the batteries. The batteries should last at least 100,000 mi (160,900 km) in normal service.
Nickel Metal Hydride Batteries
Nickel metal hydride batteries are offered as the best of the next generation of batteries. They have a high specific energy: around 40.8 Wh/lb (90 Wh/kg). According to a U.S. DOE report, the batteries are benign to the environment and are recyclable. They also are reported to have a very long cycle life. Nickel metal hydride batteries have a high self-discharge rate: they lose their charge when stored for long periods of time. They are already commercially available as “AA” and “C” cell batteries, for small consumer appliances and toys. Manufacturing of larger batteries for EV applications is only available to EV manufacturers. Honda is using these batteries in the EV Plus, which is available for lease in California.
Sodium Sulfur Batteries
This battery is a high-temperature battery, with the electrolyte operating at temperatures of 572°F (300°C). The sodium component of this battery explodes on contact with water, which raises certain safety concerns. The materials of the battery must be capable of withstanding the high internal temper- atures they create, as well as freezing and thawing cycles. This battery has a very high specific energy: 50 Wh/lb (110 Wh/kg). The Ford Motor Company uses sodium sulfur batteries in their Ecostar, a converted delivery minivan that is currently sold in Europe. Sodium sulfur batteries are only available to EV manufacturers.
Lithium Iron and Lithium Polymer Batteries
The USABC considers lithium iron batteries to be the long-term battery solution for EVs. The batteries have a very high specific energy: 68 Wh/lb (150 Wh/kg). They have a molten-salt electrolyte and share many features of a sealed bipolar battery. Lithium iron batteries are also reported to have a very long cycle life. These are widely used in laptop computers. These batteries will allow a vehicle to travel distances and accelerate at a rate comparable to conventional gasoline-powered vehicles. Lithium polymer batteries eliminate liquid electrolytes. They are thin and flexible, and can be molded into a variety of shapes and sizes.
Neither type will be ready for EV commercial applications until early in the 21st century.
Zinc and Aluminum Air Batteries
Zinc air batteries are currently being tested in postal trucks in Germany. These batteries use either aluminum or zinc as a sacrificial anode. As the battery produces electricity, the anode dissolves into the electrolyte. When the anode is completely dissolved, a new anode is placed in the vehicle. The aluminum or zinc and the electrolyte are removed and sent to a recycling facility. These batteries have a specific energy of over 97 Wh/lb (200 Wh/kg). The German postal vans currently carry 80 kWh of energy in their battery, giving them about the same range as 13 gallons (49.2 liters) of gasoline. In their tests, the vans have achieved a range of 615 mi (990 km) at 25 miles per hour (40 km/h).
.
SOURCE: Rahman, Saifur “Electric Power Generation: Non-Conventional Methods”
.
Related articles
- Wind Power Storage
- Superconducting transformers
- Shielding Of Power Cables
- Corona ions (air ionisation)
- Hydropower In Details
8,036 views

Connecting wind turbines to the power grid
Precautions to be taken when connecting wind turbines to the power grid: The procedure for connecting wind turbines to an electric distribution network normally consists of 2 steps:
1. First, the HV/LV transformer is energized from the high voltage side,
2. Then, in the right wind conditions and further to wind turbine adjustment tests (initial pole test, pole test sequence, etc.), the turbine is connected to the power grid as follows:
- The rotation of the wind turbine’s blades triggers the aerogenerator (motorgenerator set), which acts as a generator,
- The transformer’s LV winding is energized by the wind turbine’s stator (connected by a star or delta connection) and hence provides electrical energy to the HV network.
However, during this 2-step process, the HV/LV transformer must not, in any event whatsoever, be supplied with high and low voltage currents at the same time. In such an event, there would be a risk of energizing the LV voltage side in opposite phase to the HV side.
The result would be an extremely strong current, the intensity of which would be greater than the brief, 3-phase short-circuit current stipulated in the contract (usually 2 seconds).

General diagram of a wind turbine installation
As the electrodynamic stress on the windings is proportional to the square of the current intensity (F = K.I2), the transformer can not, in general, withstand the extremely intense stress caused by a current greater than the contractual short-circuit current. This type of stress would automatically lead to significant, unacceptable and irreversible mechanical deformation of the LV and HV windings, and the LV connections: hence it would, in due course, totally destroy the transformer.
On-site transformer failures have occurred, as a result of energizing the LV and HV sides at the same time and failing to comply with the phase sequence of the LV network.
The LV winding was subjected to a current much stronger than the contractual 3-phase short-circuit current and, as a result, the transformer was completely destroyed by huge electrodynamic stress.
.
Measures to apply in all circumstances…

Power HV/LV Transformer
Therefore, when connecting a wind turbine transformer to a power grid, it is absolutely essential not to energize the LV and HV sides of the transformer at the same time, which may cause the LV winding to be in opposite phase.
Hence, it is extremely important not to interfere with the various tripping sequences, and to comply with the adjustment specifications for the transformer in question.
If the transformer is energized from both sides and, in addition, the phase sequence of the LV network is not respected, the result will be total transformer failure.
.
SOURCE: France Transfo
.
Related articles
- What is PowerLogic System?
- Maintenance Of High Voltage Circuit Breakers
- ABB launches new generation 420kV gas insulated switchgear
- Superconducting transformers
- Arc-resistant low voltage switchgear
18,039 views

Transformer Ratings
Transformer size or capacity is most often expressed in kVA. “We require 30 kVA of power for this system” is one example, or “The facility has a 480 VAC feed rated for 112.5 kVA”.
However, reliance upon only kVA rating can result insafety and performance problems when sizing transformers to feed modern electronic equipment.
Use of off-the-shelf, general purpose transformers for electronics loads can lead to power quality and siting problems:
- Single phase electronic loads can cause excessive transformer heating.
- Electronic loads draw non-linear currents, resulting in low voltage and output voltage distortion.
- Oversizing for impedance and thermal performance can result in a transformer with a significantly larger footprint.
It is vital for the systems designer to understand all of the factors that affect transformer effectiveness and performance.
.
Thermal Performance
Historically, transformers have been developed to supply 60 Hz, linear loads such as lights, motors, and heaters. Electronic loads were a small part of the total connected load. A system designer could be assured that if transformer voltage and current ratings were not exceeded, the transformer would not overheat, and would perform as expected. A standard transformer is designed and specified with three main parameters: kVA Rating, Impedance, and Temperature Rise.
.
KVA Rating
The transformer voltage and current specification. KVA is simply the load voltage times the load current. A single phase transformer rated for 120 VAC and 20 Amperes would be rated for 120 x 20 = 2400 VA, or 2.4 KVA (thousand VA).
.
Impedance
Transformer Impedance and Voltage Regulation are closely related: a measure of the transformer voltage drop when supplying full load current. A transformer with a nominal output voltage of 120 VAC and a Voltage Regulation of 5% has an output voltage of 120 VAC at no-load and (120 VAC – 5%) at full load – the transformer output voltage will be 114 VAC at full load. Impedance is related to the transformer thermal performance because any voltage drop in the transformer is converted to heat in the windings.
.
Temperature Rise
Steel selection, winding capacity, impedance, leakage current, overall steel and winding design contribute to total transformer heat loss. The transformer heat loss causes the transformer temperature to rise. Manufacturers design the transformer cooling, and select materials, to accommodate this temperature rise.

Transformer Heat Loss
Use of less expensive material with a lower temperature rating will require the manufacturer to design the transformer for higher airflow and cooling, often resulting in a larger transformer. Use of higher quality materials with a higher temperature rating permits a more compact transformer design.

Transformer Insulation Systems
.
“K” Factor Transformer Rating
In the 1980′s, power quality engineers began encountering a new phenomenon: non-linear loads, such as computers and peripherals, began to exceed linear loads on some distribution panels. This resulted in large harmonic currents being drawn, causing excessive transformer heating due to eddy-current losses, skin effect, and core flux density increases.
Standard transformers, not designed for nonlinear harmonic currents were overheating and failing even though RMS currents were well within transformer ratings.
In response to this problem, IEEE C57.110-1986 developed a method of quantifying harmonic currents. A “k” factor was the result, calculated from the individual harmonic components and the effective heating such a harmonic would cause in a transformer. Transformer manufacturers began designing transformers that could supply harmonic currents, rated with a “k” factor. Typical “K” factor applications include:
- K-4: Electric discharge lighting, UPS with input filtering, Programmable logic controllers and solid state controls
- K-13: Telecommunications equipment, UPS systems, multi-wire receptacle circuits in schools, health-care, and production areas
- K-20: Main-frame computer loads, solid state motor drives, critical care areas of hospitals
“K” factor is a good way to assure that transformers will not overheat and fail. However, “K” factor is primarily concerned with thermal issues. Selection of a “K” factor transformer may result in power quality improvement, but this depends upon manufacturer and design.
.
Transformer Impedance
Transformer impedance is the best measure of the transformer’s ability to supply an electronic load with optimum power quality. Many power problems do not come from the utility but are internally generated from the current requirements of other loads.
While a “K” factor transformer can feed these loads and not overheat, a low impedance transformer will provide the best quality power. As an example, consider a 5% impedance transformer. When an electronic load with a 200% inrush current is turned on, a voltage sag of 10% will result. A low impedance transformer (1%) would provide only a 2% voltage sag – a substantial improvement. Transformer impedance may be specified as a percentage, or alternately, in Ohms (Ω) from Phase- Phase or Phase-Neutral.
.
High Frequency Transformer Impedance
Most transformer impedance discussions involve the 60 Hz transformer impedance. This is the power frequency, and is the main concern for voltage drops, fault calculations, and power delivery. However, nonlinear loads draw current at higher harmonics. Voltage drops occur at both 60 Hz and higher frequencies. It is common to model transformer impedance as a resistor, often expressed in ohms. In fact, a transformer behaves more like a series resistor and inductor.
The voltage drop of the resistive portion is independent of frequency, the voltage drop of the inductor is frequency dependent.
Standard Transformer impedances rise rapidly with frequency. However, devices designed specifically for use with nonlinear loads use special winding and steel lamination designs to minimize impedance at both 60 Hz and higher frequencies. As a result, the output voltage of such designs is far better quality than for standard transformers.
.
Recommendations for Transformer Sizing
System design engineers who must specify and apply transformers have several options when selecting transformers.
.
Do It Yourself Approach
With this approach, a larger than required standard transformer is specified in order to supply harmonic currents and minimize voltage drop. Transformer oversizing was considered prudent design in the days before transformer manufacturers understood harmonic loads, and remains an attractive option from a pure cost standpoint. However, such a practice today has several problems:
- A larger footprint and volume than low impedance devices specifically designed for non-linear loads
- Poor high frequency impedance
- Future loads may lead to thermal and power quality problems

Standard Isolation Transformer
.
“K”-factor Rated Transformers
Selecting and using “K”-factor rated transformers is a prudent way to ensure that transformer overheating will not occur. Unfortunately, lack of standardization makes the “K” factor rating a measure only of thermal performance, not impedance or power quality.

Percent Impedance
Some manufacturers achieve a good “K” factor using design techniques that lower impedance and enhance power quality, others simply derate components and temperature ratings. Only experience with a particular transformer manufacturer can determine if a “K” factor transformer addresses both thermal and power quality concerns.
.
Transformers Designed for Non-Linear Loads
Transformers designed specifically for non-linear loads incorporate substantial design improvements that address both thermal and power quality concerns. Such devices are low impedance, compact, and have better high frequency performance than standard or “K” factor designs. As a result, this type of transformer is the optimum design solution.
This type of transformer may be more expensive than standard transformers, due to higher amounts of iron and copper, higher quality materials, and more expensive winding and stacking techniques. However, the benefits of such a design in power quality and smaller size justify the extra cost, and make the low impedance transformer the most cost effective design overall.
.
Related articles
- Transformer heating and cooling
- The Unique Role Of Wind Turbine Step-Up (WTSU) Transformers
- Dry-Type disc wound transformers in MV applications
- ABB Power Transformers – A guide to manufacturing
- Line Protection With Distance Relays

Thin Film Solar
While silicon is the industry common semiconductor in many electric units, which includes the photovoltaic cells that pv panels use to transform sunshine into power, it is not really the most efficient material on the market.
For instance, the semiconductor gallium arsenide and associated ingredient semiconductors give nearly double the performance as silicon in solar devices, but they are rarely used in utility-scale applications because of their excessive manufacturing cost. University of Illinois. (http://illinois.edu/) teachers J. Rogers and X. Li explored lower-cost methods to produce thin films of gallium arsenide that also made possible usefulness in the types of products they might be integrated into.
If you can minimize significantly the cost of gallium arsenide and some other compound semiconductors, then you might expand their range of applications.
Usually, gallium arsenide is placed in a single thin layer on a small wafer. Either the ideal device is created right on the wafer, or the semiconductor-coated wafer is cut up into chips of the desired size. The Illinois group made the decision to put in several levels of the material on a simple wafer, producing a layered, “pancake” stack of gallium arsenide thin films.
If you grow ten layers in 1 growth, you simply have to fill the wafer one time. If you do this in ten growths, loading and unloading with temp ramp-up and ramp-down take a lot of time. If you consider exactly what is needed for each growth – the machine, the preparation, the time, the workers – the overhead saving this solution gives is a important expense reduction.
Following the researchers independently peel off the levels and transfer them. To accomplish this, the stacks alternate layers of aluminum arsenide with the gallium arsenide. Bathing the stacks in a solution of acid and an oxidizing agent dissolves the layers of aluminum arsenide, freeing the individual small sheets of gallium arsenide.
A soft stamp-like system picks up the levels, one at a time from the top down, for shift to another substrate – glass, plastic-type or silicon, depending on the application. After that the wafer can be used again for another growth.
By performing this it’s possible to create a lot more material much more rapidly and much more price efficiently. This process could produce bulk quantities of material, as opposed to simply the thin single-layer manner in which it is usually grown.

Small Sheets Of Gallium arsenide
Freeing the material from the wafer additionally opens the chance of flexible, thin-film electronics made with gallium arsenide or some other high-speed semiconductors. To make products that could conform but still keep higher efficiency, that is significant.
In a paper written and published on-line May 20 in the publication Nature (http://www.nature.com/), the team details its methods and shows three types of products using gallium arsenide chips manufactured in multilayer stacks: light products, high-speed transistors and solar cells. The authors also provide a comprehensive cost comparison.
Another benefit of the multilayer method is the release from area constraints, particularly important for photo voltaic cells. As the levels are eliminated from the stack, they may be laid out side-by-side on one more substrate to generate a significantly bigger surface area, whereas the typical single-layer procedure limits area to the size of the wafer.
For photovoltaics, you want big area coverage to get as much sunshine as achievable. In an extreme case we could develop adequate layers to have 10 times the area of the traditional.
After that, the group programs to explore more potential product applications and additional semiconductor materials which could adapt to multilayer growth.
.
SOURCE: University of Illinois Researchers Demonstrate Us Little Known Methods to Produce More Efficient Solar panels
AUTHOR: Shannon Combs | residentialsolarpanels.org
.
Related articles
5,839 views

KNX Architecture
Building Control technology as provided by KNX is a specialized form of automated process control, dedicated to the needs of home and building applications. One premise for KNX is to furnish a radically decentralized, distributed approach; hence the term network.
The KNX Device Network results from the formal merger of the 3 leading systems for Home and Building Automation (EIB, EHS, BatiBus) into the specification of the new KNX Association. The common specification of the “KNX” system provides, besides powerful runtime characteristics, an enhanced “toolkit” of services and mechanisms for network management.
On the KNX Device Network, all the devices come to life to form distributed applications in the true sense of the word. Even on the level of the applications themselves, tight interaction is possible, wherever there is a need or benefit. All march to the beat of powerful Interworking models with standardized Datapoint Types and “Functional Block” objects, modelling logical device channels.
The mainstay of S-(“System”) Mode is the centralized free binding and parameterisation (typically with the PC-based ETS tool). It is joined by E (“Easy”)-mode device profiles, which can be configured according to a structured binding principle, through simple manipulations – without the need for a PC tool. These configuration modes share common run-time Interworking, allowing the creation of a comprehensive and multi-domain home and building communication system.
The available Twisted Pair and Powerline communication media are completed with Radio Frequency (868 MHz band).
KNX explicitly encompasses a methodology and PC tools for Project Engineering, i.e. for linking a series of individual devices into a functioning installation, and integrating different KNX media and configuration modes. This is embodied in the vendor-independent Engineering Tool Software (ETS) suites for Windows.
Elements of the KNX Architecture
KNX specifies many mechanisms and ingredients to bring the network into operation, while enabling manufacturers to choose the most adapted configuration for their market. Figure 1 below shows an overview of the KNX model, bringing the emphasis on the various open choices. Rather than a formal protocol description, the following details the components or bricks that may be chosen to implement in the devices and other components a full operational system.

As essential ingredients of KNX, we find in a rather top-down view.
- Interworking and (Distributed) Application Models for the various tasks of Home and Building Automation; this is after all the main purpose of the system.
- Schemes for Configuration and Management, to properly manage all resources on the network, and to permit the logical linking or binding of parts of a distributed application, which run in different nodes. KNX structures these in a comprehensive set of Configuration Modes.
- Communication System, with a set of physical communication media, a message protocol and corresponding models for the communication stack in each node; this Communication System has to support all network communication requirements for the Configuration and Management of an installation, as well as to host Distributed Applications on it. This is typified by the KNX Common Kernel.
- Concrete Device Models, summarized in Profiles for the effective realization and combination of the elements above when developing actual products or devices, which will be mounted and linked in an installation.
Applications, Interworking and Binding
Central to KNX’ application concepts is the idea of Datapoints: they represent the process and control variables in the system, as explained in the section Application Models. These Datapoints may be inputs, outputs, parameters, diagnostic data,…The standardized containers for these Datapoints are Group Objects and Interface Object Properties.
The Communication System and Protocol are expected to offer a reduced instruction set to read and write (set and get) Datapoint values: any further application semantics is mapped to the data format and the bindings, making KNX primarily “data driven”.
In order to achieve Interworking, the Datapoints have to implement Standardized Datapoint Types, themselves grouped into Functional Blocks. These Functional Blocks and Datapoint Types are related to applications fields, but some of them are of general use and named functions of common interest (such as date and time).
Datapoints may be accessed through unicast or multicast mechanisms, which decouple communication and application aspects and permits a smooth integration between implementation alternatives. The Interworking section below zooms in on these aspects. To logically link (the Datapoints of) applications across the network, KNX has three underlying binding schemes: one for free, one for structured and one for tagged binding. How these may be combined with various addressing mechanisms is described below.
Basic Configuration Schemes
Roughly speaking, there are two levels at which an installation has to be configured. First of all, there is the level of the network topology and the individual nodes or devices.
In a way, this first level is a precondition or “bootstrap” phase, prior to the configuration of the Distributed Applications, i.e. binding and parameter setting.
Configuration may be achieved through a combination of local manipulations on the devices (e.g. pushing a button, setting a codewheel, or using a locally connected configuration tool), and active Network Management communication over the bus (peer-to-peer as well as more centralized master- slave schemes are defined).
As described in the corresponding section below, a KNX Configuration Mode:
- picks out a certain scheme for configuration and binding
- maps it to a particular choice of address scheme
- completes all this with a choice of management procedures and matching resource realizations.
Some modes require more active management over the bus, whereas some others are mainly oriented towards local configuration.
Network Management and Resources
To accommodate all active configuration needs of the system, and maintain unity in diversity, KNX is equipped with a powerful toolkit for network management. One can put these instruments to good use throughout the lifecycle of an installation: for initial set-up, for integration of multi-mode installations, for subsequent diagnostics and maintenance, as well as for later extension and reconfiguration. Network Management in KNX specifies a set of mechanisms to discover, set or retrieve configuration data actively via the network. It proposes Procedures (i.e. message sequences) to access values of the different network resources within the devices, as well as identifiers and formats for these resources – all of this in order to enable a proper Interworking of all KNX network devices. These resources may be addresses, communication parameters, application parameters, or complex sets of data like binding tables or even the entire executable application program.
The network management basically makes use of the services offered by the application layer. Each device implementing a given configuration mode (see below) has to implement the services and resources specified in the relevant “profile” (set of specifications, see below).
For managing the devices, these services are used within procedures. The different configuration modes make use of an identified set of procedures, which are described in the “configuration management” part. As indicated above, and further demonstrated in the Configuration Modes section below, KNX supports a broad spectrum of solutions here, ranging from centralized and semi- centralised “master-slave” versions, over entirely peer-to-peer to strictly local configuration styles.
However, mechanisms and Resources are not enough. Solid Network Management has to abide by a set of consistency rules, global ones as well as within and among profiles, and general Good Citizenship. For example, some of these rules govern the selection of the (numerical value of) the address when binding Datapoints.
But now, we first turn our attention to how the Communication System’s messaging solutions for applications as well as management, beginning with the physical transmission media.
Communication: Physical Layers
The KNX system offers the choice for the manufacturers, depending on his market requirements and habits, to choose between several physical layers, or to combine them. With the availability of routers, and combined with the powerful Interworking, multi-media, and also multi-vendor configurations can be built.
The different media are :
- TP 1 (basic medium inherited from EIB) providing a solution for twisted pair cabling, using a SELV network and supply system. Main characteristics are: data and power transmission with one pair (devices with limited power consumption may be fed by the bus), and asynchronous character oriented data transfer and half duplex bi-directional communication. TP 1 transmission rate is 9600 bit/s.
TP1 implements a CSMA/CA collision avoidance. All topologies may be used and mixed ( line, star, tree, ….) - PL 110 (also inherited from EIB) enables communication over the mains supply network. Main characteristics are: spread frequency shift keying signalling, asynchronous transmission of data packets and half duplex bi-directional communication. PL 110 uses the central frequency 110 kHZ and has a data rate of 1200 bit/s.
PL110 implements CSMA and is compliant to EN 50065-1 (in the frequency band without standard access medium protocol). - RF enables communication via radio signals in the 868,3 MHz band for Short Range Devices. Main characteristics are: Frequency Shift Keying, maximum duty cycle of 1%, 32 768 cps, Manchester data encoding.
- Beyond these Device Network media, KNX has unified service- and integration solutions for IP-enabled (1) media like Ethernet (IEEE 802.2), Bluetooth, WiFi/Wireless LAN (IEEE 802.11), “FireWire” (IEEE 1394) etc., as explained in the KNXnet/IP section below.
Communication: Common Kernel and Message Protocol
The Communication System must tend to the needs of the Application Models, Configuration and Network Management. On top of the Physical Layers and their particular Data Link Layer, a Common Kernel model is shared by all the devices of the KNX Network; in order to answer all requirements, it includes a 7 Layers OSI model compliant communication system.
- Data Link Layer General, above Data Link Layer per medium, provides the medium access control and the logical link control.
- Network Layer provides a segment wise acknowledged telegram; it also controls the hop count of a frame. Network Layer is of interest mainly for nodes with routing functionality.
- Transport Layer (TL) enables 4 types communication relationship between communication points: one-to-many connectionless (multicast), one-to-all connectionless (broadcast), one-to-one connectionless, one-to-one connection-oriented. For freely bound models (see below), TL also separates (“indirects”) the network multicast address from the internal representation.
- Session and presentation Layers are empty.
- Application Layer offers a large “toolkit” variety of application services to the application process. These services are different depending on the type of communication used at transport layer. Services related to point-to-point communication and broadcast mainly serve to the network management, whereas services related to multicast are intended for runtime operation.
Remember KNX does not fix the choice of microprocessor. Since in addition, KNX covers an extensive range of configuration and device models, the precise requirements governing a particular implementation are established in detailed Profiles, in line with the Configuration Modes. Within these boundaries, the KNX developer is encouraged to find the optimal solution to accommodate his implementation requirements! This is expounded in later sections.
Related articles
- IEC 61850 Standard In Details (2)
- IEC 61850 Standard In Details (1)
- What is PowerLogic System?
- Wind Power Applications
- The Benefits of VFDs In HVAC Systems
6,465 views

Acti 9 - The Fifth Generation Of Modular Systems
Acti 9 represents the fifth generation of Schneider’s low voltage modular systems. His older brother Multi 9 has finally evolved to much better and smarter system. Multi 9 was the famous and most known product of Schneider’s ex brand Merlin Gerin (now is incorporated into Schneider global brand), and now new Acti 9 is ready to inherit it.
Before Acti 9 – iC60 and Multi 9 – C60 modular systems, there was also Multi 9 – C32, F32 and F70 at the beginning of development.
Acti 9 covers all applications, especially in polluted environments and networks, for absolute safety and improved continuity of service.
Acti 9 exclusivities
For absolute safety and improved continuity of service.
- VISI-SAFE – Guaranteed safe intervention on site
- VISI-TRIP – Fast location of the faulty outgoer to minimize dowtime
- The super immunization “Si” on RCD – Improved continuity of service, especially in polluted environments and networks
- Front face class 2 - Continuous safety for operators and non-qualified personnel

VISI-SAFE concept is combining:
- Contact position indication with the green strip
- Impulse voltage withstand: Uimp 6 kV
- Insulation voltage: Ui 500 V
- Pollution degree: level 3 (conductive pollution, dust,etc.)
Easy to choose
- Compliance with both IEC/EN 60898 & IEC/EN 60947-2 - Suitable for commercial and industrial applications
- RCDs fully coordinated up to the MCB’s breaking capacity – Peace of mind, easy to select
.
Easy to install
- Quick and ergonomic wiring, safe connections
- IP20 insulated flap terminals
- Distribloc system - Twice the standard terminal tightening torque
.
Easy to operate
- Great readability:
- large circuit labelling area
- specific colour code system. - Upgradeability with Multiclip system
- Load rebalancing and addition of new outgoers.
- Device removable with comb busbar in place
- Double locking.
Related articles
- Arc-resistant low voltage switchgear
- Shielding Of Power Cables
- Standard IEC 60947-2
- GE AKD-20 Low-Voltage Switchgear
- Guide To Low Voltage Busbar Trunking Systems (1)
17,041 views

Transformer Oil Diagnostics
In addition to dissipating heat due to losses in a transformer, insulating oil provides a medium with high dielectric strength in which the coils and core are submerged. This allows the transformers to be more compact, which reduces costs. Insulating oil in good condition will withstand far more voltage across connections inside the transformer tank than will air. An arc would jump across the same spacing of internal energized components at a much lower voltage if the tank had only air. In addition, oil conducts heat away from energized components much better than air.
Over time, oil degrades from normal operations, due to heat and contaminants. Oil cannot retain high dielectric strength when exposed to air or moisture. Dielectric strength declines with absorption of moisture and oxygen. These contaminants also deteriorate the paper insulation. For this reason, efforts are made to prevent insulating oil from contacting air, especially on larger power transformers. Using a tightly sealed transformer tank is impractical, due to pressure variations resulting from thermal expansion and contraction of insulating oil. Common systems of sealing oil-filled transformers are the conservator with a flexible diaphragm or bladder or a positivepressure inert-gas (nitrogen) system. Reclamation GSU transformers are generally purchased with conservators, while smaller station service transformers have a pressurized nitrogen blanket on top of oil. Some station service transformers are dry-type, self-cooled or forcedair cooled.
Conservator System
A conservator is connected by piping to the main transformer tank that is completely filled with oil. The conservator also is filled with oil and contains an expandable bladder or diaphragm between the oil and air to prevent air from contacting the oil. Figure 1 is a schematic representation of a conservator system (figure 1 is an actual photo of a conservator).

Figure 1: Conservator with Bladder
Air enters and exits the space above the bladder/diaphragm as the oil level in the main tank goes up and down with temperature. Air typically enters and exits through a desiccant-type air dryer that must have the desiccant replaced periodically. The main parts of the system are the expansion tank, bladder or diaphragm, breather, vent valves, liquid-level gauge and alarm switch. Vent valves are used to vent air from the system when filling the unit with oil. A liquid-level gauge indicates the need for adding or removing transformer oil to maintain the proper oil level and permit flexing of the diaphragm.
Oil-Filled, Inert-Gas System
A positive seal of the transformer oil may be provided by an inert-gas system. Here, the tank is slightly pressurized by an inert gas such as nitrogen. The main tank gas space above the oil is provided with a pressure gauge (figure 12. Since the entire system is designed to exclude air, it must operate with a positive pressure in the gas space above the oil; otherwise, air will be admitted in the event of a leak. Smaller station service units do not have nitrogen tanks attached to automatically add gas, and it is common practice to add nitrogen yearly each fall as the tank starts to draw partial vacuum, due to cooler weather. The excess gas is expelled each summer as loads and temperatures increase. Some systems are designed to add nitrogen automatically (figure 2) from pressurized tanks when the pressure drops below a set level. A positive pressure of approximately 0.5 to 5 pounds per square inch (psi) is maintained in the gas space above the oil to prevent ingress of air. This system includes a nitrogen gas cylinder; three-stage, pressure-reducing valve; high-and low-pressure gauges; high-and low-pressure alarm switch; an oil/condensate sump drain valve; an automatic pressure-relief valve; and necessary piping.

Figure 2: Typical Transformer Nitrogen System
The function of the three-stage, automatic pressure-reducing valves is to reduce the pressure of the nitrogen cylinder to supply the space above the oil at a maintained pressure of 0.5 to 5 psi. The high-pressure gauge normally has a range of 0 to 4,000 psi and indicates nitrogen cylinder pressure. The low-pressure gauge normally has a range of about -5 to +10 psi and indicates nitrogen pressure above the transformer oil. In some systems, the gauge is equipped with high- and low-pressure alarm switches to alarm when gas pressure reaches an abnormal value; the high-pressure gauge may be equipped with a pressure switch to sound an alarm when the supply cylinder pressure is running low. A sump and drain valve provide a means for collecting and removing condensate and oil from the gas. A pressure-relief valve opens and closes to release the gas from the transformer and, thus, limit the pressure in the transformer to a safe maximum value.
As temperature of a transformer rises, oil expands, and internal pressure increases, which may have to be relieved. When temperature drops, pressure drops, and nitrogen may have to be added, depending on the extent of the temperature change and pressure limits of the system.
.
Related articles
- Substation ventilation
- ABB Power Transformers – A guide to manufacturing
- Corona ions (air ionisation)
- The Unique Role Of Wind Turbine Step-Up (WTSU) Transformers
- Transformer Ratings

Procedure for the establishment of a new substation
Large consumers of electricity are invariably supplied at HV. On LV systems operating at 120/208 V (3-phase 4-wires), a load of 50 kVA might be considered to be “large”, while on a 240/415 V 3-phase system a “large” consumer could have a load in excess of 100 kVA. Both systems of LV distribution are common in many parts of the world. As a matter of interest, the IEC recommends a “world” standard of 230/400 V for 3-phase 4-wire systems.
This is a compromise level and will allow existing systems which operate at 220/380 V and at 240/415 V, or close to these values, to comply
with the proposed standard simply by adjusting the off-circuit tapping switches of standard distribution transformers.
The distance over which the load has to be transmitted is a further factor in considering an HV or LV service. Services to small but isolated rural consumers are obvious examples. The decision of a HV or LV supply will depend on local circumstances and considerations such as those mentioned above, and will generally be imposed by the utility for the district concerned.
When a decision to supply power at HV has been made, there are two widely followed methods of proceeding:
- The power-supplier constructs a standard substation close to the consumer’s premises, but the HV/LV transformer(s) is (are) located in transformer chamber(s) inside the premises, close to the load centre
- The consumer constructs and equips his own substation on his own premises, to which the power supplier makes the HV connection
In method no. 1 the power supplier owns the substation, the cable(s) to the transformer(s), the transformer(s) and the transformer chamber(s), to which he has unrestricted access. The transformer chamber(s) is (are) constructed by the consumer (to plans and regulations provided by the supplier) and include plinths, oil drains, fire walls and ceilings, ventilation, lighting, and earthing systems, all to be approved by the supply
authority.
The tariff structure will cover an agreed part of the expenditure required to provide the service. Whichever procedure is followed, the same principles apply in the conception and realization of the project. The following notes refer to procedure no. 2.
Preliminary information
Before any negotiations or discussions can be initiated with the supply authorities, the following basic elements must be established:
.
Maximum anticipated power (kVA) demand
Determination of this parameter is described in Chapter B, and must take into account the possibility of future additional load requirements. Factors to evaluate at this stage are:
- The utilization factor (ku)
- The simultaneity factor (ks)
.
Layout plans and elevations showing location of proposed substation
Plans should indicate clearly the means of access to the proposed substation, with dimensions of possible restrictions, e.g. entrances corridors and ceiling height, together with possible load (weight) bearing limits, and so on, keeping in mind that:
- The power-supply personnel must have free and unrestricted access to the HV equipment in the substation at all times
- Only qualified and authorized consumer’s personnel are allowed access to the substation
- Some supply authorities or regulations require that the part of the installation operated by the authority is located in a separated room from the part operated by the customer.
.
Degree of supply continuity required
The consumer must estimate the consequences of a supply failure in terms of its duration:
- Loss of production
- Safety of personnel and equipment
The utility must give specific information to the prospective consumer.
Project studies
From the information provided by the consumer, the power-supplier must indicate:
The type of power supply proposed and define
- The kind of power-supply system: overheadline or underground-cable network
- Service connection details: single-line service, ring-main installation, or parallel
feeders, etc. - Power (kVA) limit and fault current level
.
The nominal voltage and rated voltage
(Highest voltage for equipment) Existing or future, depending on the development of
the system.
.
Metering details which define:
- The cost of connection to the power network
- Tariff details (consumption and standing charges)
.
Implementation
Before any installation work is started, the official agreement of the power-supplier must be obtained. The request for approval must include the following information, largely based on the preliminary exchanges noted above:
- Location of the proposed substation
- One-line diagram of power circuits and connections, together with earthing-circuit
proposals - Full details of electrical equipment to be installed, including performance
characteristics - Layout of equipment and provision for metering components
- Arrangements for power-factor improvement if eventually required
- Arrangements provided for emergency standby power plant (HV or LV) if eventually
required
The utility must give official approval of the equipment to be installed in the substation, and of proposed methods of installation.
Commissioning
When required by the authority, commissioning tests must be successfully completed before authority is given to energize the installation from the power supply system.
After testing and checking of the installation by an independent test authority, a certificate is granted which permits the substation to be put into service.
Even if no test is required by the authority it is better to do the following verification tests:
- Measurement of earth-electrode resistances
- Continuity of all equipotential earth-and safety bonding conductors
- Inspection and testing of all HV components
- Insulation checks of HV equipment
- Dielectric strength test of transformer oil (and switchgear oil if appropriate)
- Inspection and testing of the LV installation in the substation,
- Checks on all interlocks (mechanical key and electrical) and on all automatic
sequences - Checks on correct protective-relay operation and settings
.
It is also imperative to check that all equipment is provided, such that any properly executed operation can be carried out in complete safety. On receipt of the certificate of conformity (if required): - Personnel of the power-supply authority will energize the HV equipment and check
for correct operation of the metering - The installation contractor is responsible for testing and connection of the LV installation
.
When finally the substation is operational: - The substation and all equipment belongs to the consumer
- The power-supply authority has operational control over all HV switchgear in the substation, e.g. the two incoming load-break switches and the transformer HV switch (or CB) in the case of a MV switchgear, together with all associated HV earthing switches
- The power-supply personnel has unrestricted access to the HV equipment
- The consumer has independent control of the HV switch (or CB) of the transformer(s) only, the consumer is responsible for the maintenance of all substation equipment, and must request the power-supply authority to isolate and earth the switchgear to allow maintenance work to proceed.
.
The power supplier must issue a signed permitto- work to the consumers maintenance personnel, together with keys of locked-off isolators, etc. at which the isolation has been carried out.
.
Related articles
- Substation, Its Function And Types
- Corona ions (air ionisation)
- Field Test Procedure For Protective Relays
- High Voltage Substation Earth Grid Impedance Testing
- Benefits Of IEC 61850
11,093 views

Galaxy 7000 UPS 250-500kVA by APC
Three-phase Galaxy 7000, 250 to 500 kVA (up to 4 MVA in parallel configurations), includes cutting-edge technologies for high-power applications.
Calling on over 40 years of experience in the Critical Power and Cooling Services division of Schneider Electric, the leader in complete, high-quality electrical power solutions, Galaxy 7000 offers optimised performance for data centers, infrastructure and industrial processes. The compact size, back-to-back or back-to-wall installation enables more room to be utilised for other equipments in the technical room than traditional UPS systems. The UPS can be upgraded to ensure available and secure power infrastructure for current as well as future demands.
Applications
Galaxy 7000 increases the productivity of these applications by providing continuity of service through secure supply solutions that are flexible, adaptable and upgradeable. Galaxy 7000 provides high-quality energy, compatible with all loads, with a very high level of availability. The variety of architectures meets the specific needs of each installation and allows easy upgrading. The communication capabilities and proactive services provided by Schneider Electric, the most complete and available worldwide, make for highly effective maintenance.
- Data Centers
The strategic and economic importance of data centers made it necessary to set up the ANSI/TIA site typology (TIER I to IV). It presents the necessary functions of the major components, including supply via UPSs, to ensure consistency and obtain a high level of overall availability.
.
Galaxy 7000, through its design and many possibilities for parallel connection, as well as its compatibility with STS (static transfer switch) systems, meets TIER IV requirements for fault-tolerant sites offering the highest level of availability (99.995%).
.
Combined with STS units, Galaxy 7000 can supply energy via two or three different channels for dual or triple-attach applications and also offers supervision, network administration and remote-control solutions. Galaxy 7000 is ideal for the large (over 500 square metre) data centers of banks, insurance companies, internet and colocation services, telecoms, etc. where 24/365 operation is mandatory and preventive maintenance and upgrades must not require system shutdown.
- Infrastructure and buildings
Service continuity is also required for infrastructure (airports, ports, tunnels) as well as the operation and technical monitoring (via SCADA and BMS systems) of shopping centres, hospitals, office buildings, etc. Galaxy 7000 is perfectly suited to the needs of these communicating, frequently upgraded applications thanks to its power ratings, extension possibilities and communication capabilities.
. - Industrial processes
Operation in industrial environments requires equipment capable of maintaining processes, without failure, under difficult conditions, including dust, humidity, vibrations, major variations in temperature, etc. Due to its high electrical and mechanical level of performance, Galaxy 7000 meets these specific needs.
.
Technical files are available for all the applications specified by design offices, including Ni-Cad batteries for the chemical and petrochemical industries, high IP values, heavy-duty reinforced cabinets, dust filters, marine configurations, rated voltages up to 440 V, etc. The MGE UPS SYSTEMS design office, in conjunction with a specialised industrial organisation, can also handle uncommon conditions, e.g. outdoor installations, anti-vibration bases for marine applications, special paints with the corresponding labels, etc.
. - Colour
Light grey RAL 9023

Fig. 2. Applications such as data centers, infrastructure and industrial processes.
Strong Points
Galaxy 7000 design combines the best technology (double conversion) with the most recent innovations to supply high-quality power, available 24/365, to high-power applications, whatever the situation in the distribution system.
- Double conversion technology (VFI as per IEC 62040-3/EN 62040-3).
This is the only technology that insulates the load from the upstream network and completely regenerates the output voltage, thus providing high-quality, stable power.
- IGBT-based, PFC sinusoidal-current input rectifier. The rectifier draws sinusoidal current, without any reactive power, thus avoiding disturbances upstream by reducing harmonic reinjection.
• Very low current total harmonic distortion THDI, less than 5%.
• Input power factor (PF) greater than 0.99 from 50% load upwards.
.
These performance levels, combined with the three-phase input not requiring neutral, offer substantial savings in terms of cables and equipment.

Fig. 3. Three-phase, PFC sinusoidal-current rectifier, with DualPack IGBTs.
- Battery charger separated from the AC input. The chopper is supplied via the rectifier output and is thus protected against fluctuations on the AC input. Battery recharge is adjusted as a function of the temperature.
- A check on the phase sequence is run to protect the power system from the effects of incorrect connections.
- Wide input-voltage (250 to 470 V) and frequency (45 to 65 Hz) range. This is made possible by double-conversion technology and the PFC rectifier which is compatible with all sources and with disturbed distribution systems (voltages as low as 250 V for 30% load).

Fig. 4. Wide input-voltage range.
- Soft start. This system provides total compatibility with gensets through gradual start of the rectifier, in addition to a PF of 0.99. It makes it possible:
• when AC power is absent, to progressively transfer the load from the battery to the genset
• when the normal AC source returns to tolerances, to delay transfer from the battery to the rectifier, thus avoiding excessive variations on the AC source.
• in a parallel system, to set up sequential start-up of the inverters.
Fig. 5. Soft start walk-in ramp with time delay.
- Cold start on battery power if the AC source is absent or disturbed, even in parallel systems.
- High-quality output voltage (380, 400, 415 or440 V) for all types of loads with:
• THDU < 3%
• output PF = 09 for all types of load.
The range is suitable for the most recent non-linear and computer loads, called capacitive loads, with a leading PF close to 0.9 and a high crest factor.
- Output voltage adjustable to ± 3% of the rated value (in 0.5 V steps) to take into account voltage drops in long cables.
- Excellent response to load step changes, < 2% for 100 to 0% or 0 to 100% and return to the ± 1% tolerances within 100 ms.
- High current-limiting capacity for inverter short-circuits (2.5 In, 150 ms) to facilitate discrimination with downstream protective devices and accept high crest factors, 2.4:1 up to 3:1, depending on the voltage and power levels.
- Intelligent thermal-overload capacity curve for better performance. The curve is adjusted as a function of the ambient temperature, 1.5 In / 30 seconds, 1.25 In / 10 minutes.
Advanced management to extend battery life
Galaxy 7000 proposes backup times from 5 minutes to 2 hours with a rapid charger (recharge < 6 hours for 10-minute backup time). Backup time remains available due to digital battery management and the protection systems.
- The standard “DigiBat™” system monitors the battery to forward information and maximise performance. Based on a large number of parameters (percent load, temperature, battery type and age), DigiBat controls the battery charge voltage and continuously calculates:
• the real available backup time
• the remaining battery life (1).
.
DigiBat also offers:
• automatic entry of battery parameters
• test on battery status to preventively detect operating faults
• automatic battery discharge test at adjustable time intervals
• protection against deep discharge taking into account the discharge rate, with a circuit breaker to isolate the battery. The breaker opens automatically after double the specified backup time plus two hours (sleep mode to provide vital functions)
• limiting of the battery charge current (0.05 C10 to 0.1 C10)
• gradual alarm signalling the end of backup time
• numerous automatic tests.Fig. 10. Digibat.
- The B1000 battery monitoring or “Cellwatch” option monitors all battery strings 24/365 and displays a failure prediction for each block.
User-friendly interface for more dependable operation
Galaxy 7000 has a control and display interface offering intuitive functions. Based on graphs and pictograms, the interface can be set up in 19 languages including Chinese, Korean, Thai, Indonesian, Turkish and Greek. It includes a graphical display for time-stamped events and useful operating statistics. For operating personnel, that is an essential aspect in facilitating decisions. Simple and user-friendly, the interface enhances safety and comfort.
- Graphical display with HD, B&W touch screen (SVGA).
- Animated mimic panel.
- Menu keys and direct access to display functions.
- Buzzer.
- Remote supervision that can run under many BMS systems and network
supervisors via the communication cards. - Time-stamping of last 2500 events.
- On-line help to assist with the displayed messages.
- Multi-mode for parallel units (modular UPSs in parallel, parallel UPSs with SSC, frequency converters in parallel), i.e. it is possible to read the measurements of any unit on any unit, or to read system data.Fig. 11. HMI with display, LEDs, keys and mimic panel
Advanced communication
Galaxy 7000 offers the entire MGE UPS SYSTEMS range of communication systems designed to meet three essential needs.
- Inform on UPS operation and its environment, warn users, wherever they may be, concerning any potential and existing problems.
- Protect server data by automatic, clean shutdown of operating systems
- Actively supervise an entire set of UPSs.
These functions are carried out by hot-swappable communication cards running
under different protocols, depending on the environment in which Galaxy 7000 is
installed. - Standard relay card with programmable dry contacts (4 logic inputs and 6 logic
outputs). - INMC (Industrial Network Management Card) communication card with two
ports:
• JBus/ModBus RS485/RS232 protocol for communication with a BMS
• Ethernet 10/100 Mbps protocol using the Https standard (secure connection) for
supervision via the web.
Each UPS then has its own IP address making it possible for the user to:
• supervise and control the UPS via a simple browser (HTTP)
• interface with an SNMP administration system (HP Openview, etc.)
• communicate with shutdown modules installed on the protected servers
• set up external temperature and humidity monitoring (sensor environment)
• receive e-mail alarms. - NMTC (Network Management Teleservice Card) communication card with three
ports:
• JBus/ModBus RS232/RS485
• Ethernet 10/100 Mbps using the Https protocol.
The functions are identical to the INMC card, with in addition:
• a modem connection may be used to connect the UPS to the MGE Teleservice
centre for remote monitoring. - Life Cycle Monitoring software for optimised maintenance.
- Compatible with CPSOL software from Schneider Electric for complete
installation design.
Installation
Galaxy 7000 uses the latest technical and mechanical advances in terms of electrical components and power electronics. The greatly reduced number of components offers:
- an overall solution that is very compact, but high accessible for maintenance
- integration of many functions in a single cabinet. The batteries, installed in a
separate cabinet, can be hot-swapped (with the UPS supplying the load).
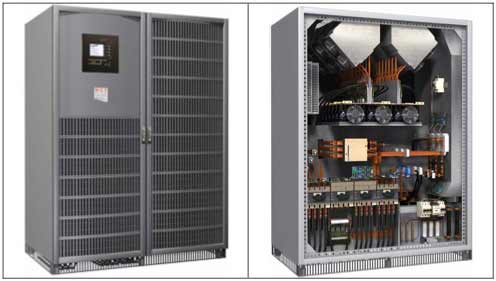
The UPS can be installed in both technical and computer rooms.
- The UPS can operate correctly back to the wall or back to back, but it is preferable to leave some space (> 600 mm) for easier maintenance.
- Leave one meter of free space in front of the UPS for door opening.
- At least 500 mm of clearance above the UPS is required.
Equipment and diagrams
Galaxy 7000 UPS units offer the following equipment and functions.
Standard configuration
- IGBT-based, PFC three-phase rectifier
- Phase-sequence check on input
- Chopper for battery charging, insulated from AC input, charge adjusted for ambient temperature
- Static switch (except parallel UPS units)
- Manual bypass (except parallel UPS units)
- Three-phase IGBT inverter with freefrequency PWM chopping
- Redundant ventilation for power components
- HMI with graphical interface, 19 languages, menu, function and ON/OFF keys
- Mimic panel with status LEDs
- Time-stamping of last 2500 events
- Battery protected against deep discharges by a circuit breaker
- Cold start on battery power
- Soft start with walk-in ramp and sequential start in parallel configurations
- EMC, level B
- Parallel connection of modular or parallel UPS units
- DigiBat digital battery monitoring and calculation of true backup time
- Programmable relay card, dry contacts, 4 logic inputs, 6 logic outputs
Options
- Connection through the top
- Isolation/voltage matching transformer
- Synchronisation module
- B1000 or Cellwatch battery-monitoring system for block by block management
- Lightning arrestor (built into the UPS cabinet)
- Backfeed protection
- Synchronisation module
- Multi-standard communication cards:
.- Jbus/Modbus + Ethernet 10/100
- Jbus/Modbus + Ethernet 10/100 + Modem
- 2 ports with dry contacts and/or remote shutdown - Battery circuit breaker unit
- Supervision and shutdown software:
- Enterprise Power Manager V.2
Electrical characteristics

.
Related articles

Testing performances of IEC 61850 GOOSE messages
One of the frequent requests for relay protection devices is support for the IEC 61850 standard. As part of the standard special messages are also planned for a quick exchange of information between the IEDs – so called GOOSE (Generic Object-Oriented SubStation Event). These are mainly trip, interlocking, breaker failure and similar signals. Time of transfer of these signals is critical, its delay may cause undesirable blackouts or damage to equipment.
In this paper we explore which software architecture is most appropriate to achieve the required performance. Software for sending / receiving GOOSE messages can be located in real time (RT) or user space of the operating system. We will consider the RT and user space implementations of two different microprocessor architecture – ARM9 and PowerPC.
Performance degradation can occur from 2 reasons:
- Protection function has the highest priority. At least 500 μs during each millisecond GOOSE thread will be deprived of CPU time.
- In the case of pure user-space implementation, the operating system will interrupt GOOSE task in a completely nondeterministic way.
User Space Test
To test the performance of GOOSE messages in user space, the environment is developed based on the ARM7 architecture:
- ARM7 with integrated Ethernet for sending, receiving and time-stamping of messages.
- The PC application for setting parameters and collecting the results.

- Figure 1 Test configuration for user space test
The essence of the test is as follows: ARM7 board launches a series of messages and records the time for each outgoing message. ARM9 and PowerPC boards are set up to immediately respond to received GOOSE messages with identical message and with the same serial number.
ARM7 registers the answer and uses the serial number to match with the original message and calculates the elapsed time.

- Figure 2 Analysis time
On the figure above we can see the analysis of time. A and B are negligible. Due to the nature of the test 2C + D can be accurately measured but we can’t know exactly the amounts of C and D are respectively. But ultimately this is not important from the point of standards. Let’s look at test results. ARM7 board launches a series of GOOSE messages with pause of 100ms. Results are measured and displayed in Excel.
To make it more realistic result overcurrent protection was turned on. Y axis shows the time in milliseconds and the X axis shows GOOSE messages.
")
- Figure 3 ARM9 100ms (X axis – number of messages, the Y axis the time of transfer)
We see that during 20 seconds response time oscillates around 2 milliseconds. The next step was to involve several protection functions. It is expected that the GOOSE performance will drop.
This is actually happening as we see in the following figure:
")
- Figure 4 ARM9 100ms, 700μs (X axis – number of messages, the Y axis the time of transfer)
The time now oscillates about 7 ms. Although it is expected that the performance will decline, it is still above expectations. 7 milliseconds is still enough for some applications. These are the results from the ARM9 platform. PowerPC platform has proved to be something better, because it has almost 2 times more processing power. On the next 2 images we see the results.
")
- Figure 5 PowerPC 100ms (X axis – number of messages, the Y axis the time of transfer)
")
- Figure 6 PowerPC 100ms, 700μs (X axis – number of messages, the Y axis the time of transfer)
In a small load time oscillates around 0.8 ms and at most about 2.5 ms. The measured times are suitable for a solid range of applications. Unfortunately, these times are only valid if the GOOSE task is only active task. In the case of other tasks – for example, disturbance recorder, event recorder, embedded web server, IEC 61850 MMS server and so on … transfer time become unpredictable and can go up to 80ms, which is of course unacceptable.
Real Time Test

- Figure 7 Test configuration for real-time test
Although the real time GOOSE is something more difficult to implement, it offers some significant advantages as we shall see. Test environment for real-time is significantly different. The network analyzer was used. The program is available as a free download from the Internet (1). The essence of the test is as follows: protection relays is configured to receive GOOSE messages from a laptop computer and to immediately respond with the same value in the dataset. When analyzing a series of messages network analyzer will come to the moment when the relay and laptops are sending an identical value.
The time between the moment when the laptop starts broadcasting and the moment the relay begins to broadcast the same value as the laptop is the required time.
In the following figure we can see the results displayed in the network analyzer.

- Figure 8 Ethereal Network Analyzer

- Figure 9 Goose series with a time of receipt of messages, network addresses and protocol label
Message number 42 is from a laptop, a message 43 from relay protection. If you subtract the time of receipt: 3.757 to 3.753 = 4msec. When measurements are repeated result oscillates around 4ms. The reason for this is that the task for sending and receiving is set to be run every 2 milliseconds.
Conclusion
At first glance, real-time and user space implementation operates in a similar timeframe. But there is a substantial difference. GOOSE RT implementation task may share the processor with an arbitrary number of other task such as the disturbance recorder and others. This architecture greatly reduces the ultimate cost of the device and gives the user more functionality. Otherwise the GOOSE software would have to reside on separate hardware.
.
AUTHOR OF ARTICLE:
Veljko Milisavljević | ABS Control Systems, Serbia
![]()
![]()
.
Related articles
- Testiranje performansi IEC 61850 GOOSE poruka
- Benefits Of IEC 61850
- IEC 61850 Standard In Details (1)
- ABB Feeder Protection REF615 ANSI
- IEC 61850 Standard In Details (2)
2,273 views
AKD-20 low-voltage switchgear continues the tradition of the AKD switchgear line while delivering enhanced arc flash protection. Built to ANSI standards, its protection features include non-vented panels plus insulated and isolated bus, and it integrates our new state-of-the-art EntelliGuard® breaker-trip unit system. It also features an optimized footprint so that it now fits into a smaller area for the most common configurations.
EntelliGuard® G circuit breakers are the newest line of GE low-voltage circuit breakers, the next step in the evolution of a line known for its exceptional designs and performance. They are available from 800A to 5000A, with fault interruption ratings up to 150kAIC – without fuses.
Integral to the EntelliGuard G line are the new, state-of-the-art EntelliGuard TU Trip Units, which provide superior system protection, system reliability, monitoring and communications. The breaker-trip unit system delivers superior circuit protection without compromising either selectivity or arc flash protection. The EntelliGuard breaker-trip unit system demonstrates yet again GE’s core competencies in reliable electric power distribution, circuit protection and personnel protection. AKD-20 includes many features that address the needs of system reliability, arc flash protection and reduced footprint size.
Features and Benefits
- The optimized footprint uses smaller section sizes when possible. Sections are provided in 22″, 30″ or 38″ widths.
- Breaker compartment doors have no ventilation openings, thus protecting operators from hot ionized gases vented by the breaker during circuit interruption.
- A superior bus system offers different levels of protection. Insulated and isolated bus makes maintenance procedures touch friendly to reduce the risk of arc flash.
- True closed-door drawout construction is standard with all AKD-20 equipment. The breaker compartment doors remain stationary and closed while the breaker is racked out from the connect position, through test, to the disconnect position. Doors are secured with rugged 1/4-turn latches.
- An easy-to-read metal instrument panel above each circuit breaker holds a variety of control circuit devices, including the RELT switch.
- Each circuit breaker is located in a completely enclosed ventilated compartment with grounded steel barriers to minimize the possibility of fault communication between compartments.
- Optional safety shutters protect operators from accidental contact with live conductors when the breaker is withdrawn.
- Easy access to equipment compartments simplifies maintenance of the breaker cubicle and control circuit elements as well as inspection of the bolted bus connections.
- The conduit entrance area meets NEC requirements. Extended depth frame options are available in 7″ and 14“ sizes for applications requiring additional cable space. The section width also can be increased for additional cable space.
- A rail-mounted hoist on top of the switchgear provides the means for installing and removing breakers from the equipment. This is a standard feature on NEMA 3R outdoor walk-in construction and optional on indoor construction.
- Control wires run between compartments in steel riser channels. Customer terminal blocks are located in metal-enclosed wire troughs in the rear cable area. Intercubicle wiring is run in a wireway on top of the switchgear, where interconnection terminal blocks are located.
- All EntelliGuard G circuit breakers are equipped with rollers and a guidebar to provide easy and accurate drawout operation.
- An optional remote racking device reduces the risk of the arc flash hazard by allowing the operator or electrician to move the breaker anywhere between the DISCONNECT and CONNECT positions from outside the arc flash boundary.
- Optional infrared (IR) scanning windows can be installed in the switchgear rear covers to facilitate the use of IR cameras for thermally scanning cable terminations.
- AKD-20 switchgear can be expanded easily to handle increased loading and system changes. Specify a requirement for a fully equipped future breaker to obtain a cubicle that has been set up for additional breaker installation, or add vertical sections without modifications or the use of transition sections.
- An array of safety interlock and padlocking features are available to accommodate any type of lockout-tagout procedure a customer may have.
- Optional Power Management: With the proper devices and GE Enervista Power Management Control System (PMCS), facility power can be tracked and controlled.
- Optional Metering and Power Quality: The latest high technology EPM devices are available for the AKD-20 with broad capabilities for usage monitoring, cost allocation, load monitoring, demand tracking, common couplings with utilities, load and process control, and power quality monitoring.
.
Related articles
- ABB launches new generation 420kV gas insulated switchgear
- Arc-resistant low voltage switchgear
- Maintenance Of Low Voltage Circuit Breakers
- Air Insulated Substations – Bus/Switching Configurations
- Short Circuit Parameters in Low Voltage AC Circuits
14,695 views

Maintenance Of SF6 Gas Circuit Breakers
Sulfur Hexafluoride (SF6) is an excellent gaseous dielectric for high voltage power applications. It has been used extensively in high voltage circuit breakers and other switchgears employed by the power industry.
Applications for SF6 include gas insulated transmission lines and’gas insulated power distributions. The combined electrical, physical, chemical and thermal properties offer many advantages when used in power switchgears.
.
Some of the outstanding properties of SF6 making it desirable to use in power applications are:
- High dielectric strength
- Unique arc-quenching ability
- Excellent thermal stability
- Good thermal conductivity
Properties Of SF6 (Sulfur Hexafuoride) Gas
- Toxicity – SF6 is odorless, colorless, tasteless, and nontoxic in its pure state. It can, however, exclude oxygen and cause suffocation. If the normal oxygen content of air is reduced from 21 percent to less than 13 percent, suffocation can occur without warning. Therefore, circuit breaker tanks should be purged out after opening.
. - Toxicity of arc products – Toxic decomposition products are formed when SF6 gas is subjected to an electric arc. The decomposition products are metal fluorides and form a white or tan powder. Toxic gases are also formed which have the characteristic odor of rotten eggs. Do not breathe the vapors remaining in a circuit breaker where arcing or corona discharges have occurred in the gas. Evacuate the faulted SF6 gas from the circuit breaker and flush with fresh air before working on the circuit breaker.
. - Physical properties – SF6 is one of the heaviest known gases with a density about five times the density of air under similar conditions. SF6 shows little change in vapor pressure over a wide temperature range and is a soft gas in that it is more compressible dynamically than air. The heat transfer coefficient of SF6 is greater than air and its cooling characteristics by convection are about 1.6 times air.
. - Dielectric strength – SF6 has a dielectric strength about three times that of air at one atmosphere pressure for a given electrode spacing. The dielectric strength increases with increasing pressure; and at three atmospheres, the dielectric strength is roughly equivalent to transformer oil. The heaters for SF6 in circuit breakers are required to keep the gas from liquefying because, as the gas liquifies, the pressure drops, lowering the dielectric strength. The exact dielectric strength, as compared to air, varies with electrical configuration, electrode spacing, and electrode configuration.
. - Arc quenching – SF6 is approximately 100 times more effective than air in quenching spurious arcing. SF6 also has a high thermal heat capacity that can absorb the energy of the arc without much of a temperature rise.
. - Electrical arc breakdown – Because of the arc-quenching ability of SF6, corona and arcing in SF6 does not occur until way past the voltage level of onset of corona and arcing in air. SF6 will slowly decompose when exposed to continuous corona.
All SF6 breakdown or arc products are toxic. Normal circuit breaker operation produces small quantities of arc products during current interruption which normally recombine to SF6. Arc products which do not recombine, or which combine with any oxygen or moisture present, are normally removed by the molecular sieve filter material within the circuit breaker.
Handling Nonfaulted SF6
The procedures for handling nonfaulted SF6 are well covered in manufacturer’s instruction books. These procedures normally consist of removing the SF6 from the circuit breaker, filtering and storing it in a gas cart as a liquid, and transferring it back to the circuit breaker after the circuit breaker maintenance has been performed. No special dress or precautions are required when handling nonfaulted SF6.
Handling Faulted SF6
Toxicity
- Faulted SF6 gas – Faulted SF6 gas smells like rotten eggs and can cause nausea and minor irritation of the eyes and upper respiratory tract. Normally, faulted SF6 gas is so foul smelling no one can stand exposure long enough at a concentration high enough to cause permanent damage.
. - Solid arc products - Solid arc products are toxic and are a white or off-white, ashlike powder. Contact with the skin may cause an irritation or possible painful fluoride burn. If solid arc products come in contact with the skin, wash immediately with a large amount of water. If water is not available, vacuum off arc products with a vacuum cleaner.
.
Clothing and safety equipment requirements
When handling and re moving solid arc products from faulted SF6, the following clothing and safety equipment should be worn:
- Coveralls – Coveralls must be worn when removing solid arc products. Coveralls are not required after all solid arc products are cleaned up. Disposable coveralls are recommended for use when removing solid arc products; however, regular coveralls can be worn if disposable ones are not available, provided they are washed at the end of each day.
. - Hoods – Hoods must be worn when removing solid arc products from inside a faulted dead-tank circuit breaker.
. - Gloves – Gloves must be worn when solid arc products are hah-died. Inexpensive, disposable gloves are recommended. Non-disposable gloves must be washed in water and allowed to drip-dry after use.
. - Boots – Slip-on boots, non-disposable or plastic disposable, must be worn by employees who enter eternally faulted dead-tank circuit breakers. Slip-on boots are not required after the removal of solid arc products and vacuuming. Nondisposable boots must be washed in water and dried after use.
. - Safety glasses – Safety glasses are recommended when handling solid arc products if a full face respirator is not worn.
. - Respirator – A cartridge, dust-type respirator is required when entering an internally faulted dead-tank circuit breaker. The respirator will remove solid arc products from air breathed, but it does not supply oxygen so it must only be used when there is sufficient oxygen to support life. The filter and cartridge should be changed when an odor is sensed through the respirator. The use of respirators is optional for work on circuit breakers whose in terrupter units are not large enough for a man to enter and the units are well ventilated.
.
Air-line-type respirators should be used when the cartridge type is ineffective due to providing too short a work time before the cartridge becomes contaminated and an odor is sensed.
When an air-line respirator is used, a minimum of two working respirators must be available on the job before any employee is allowed to enter the circuit breaker tank.
.
Disposal of waste
All materials used in the cleanup operation for large quantities of SF6 arc products shall be placed in a 55 gal drum and disposed of as hazardous waste.
The following items should be disposed of:
- All solid arc products
- All disposable protective clothing
- All cleaning rags
- Filters from respirators
- Molecular sieve from breaker and gas cart
- Vacuum filter element
.
Related articles
- Maintenance Of High Voltage Circuit Breakers
- ABB launches new generation 420kV gas insulated switchgear
- Maintenance Of Meduim Voltage Circuit Breakers
- Maintenance Of Low Voltage Circuit Breakers
- Maintenance Of Molded Case Circuit Breakers (MCCB)
3,738 views
Wind power storage development is essential for renewable energy technologies to become economically feasible. There are many different ways in which one can store electrical energy, the following outlines the various media used to store grid-ready energy produced by wind turbines. For more on applications of these wind storage technologies, read Solving the use-it-or-lose-it wind energy problem
Electrochemical Batteries
Familiar electrochemical batteries include nickel-cadmium (NiCad), lithium-ion (Li-ion, and others. Electrochemical batteries consist of two or more electrochemical cells. The cells use chemical reaction(s) to create a flow of electrons – electric current. Primary elements of a cell include the container, two electrodes (anode and cathode), and electrolyte material. The electrolyte is in contact with the electrodes. Current is created by the oxidation-reduction process involving chemical reactions between the cell’s electrolyte and electrodes.
, lithium-ion (Li-ion, and others")
Familiar electrochemical batteries include nickel-cadmium (NiCad), lithium-ion (Li-ion, and others
When a battery discharges through a connected load, electrically charged ions in the electrolyte that are near one of the cell’s electrodes supply electrons (oxidation) while ions near the cell’s other electrode accept electrons (reduction), to complete the process. The process is reversed to charge the battery, which involves ionizing of the electrolyte. An increasing number of chemistries are used for this process.
Flow Batteries
Some electrochemical batteries (e.g., automobile batteries) contain electrolyte in the same container as the cells (where the electrochemical reactions occur). Other battery types – called flow batteries – use electrolyte that is stored in a separate container (e.g., a tank) outside of the battery cell container. Flow battery cells are said to be configured as a ‘stack’. When flow batteries are charging or discharging, the electrolyte is transported (i.e., pumped) between the electrolyte container and the cell stack. Vanadium redox and Zn/Br are two of the more familiar types of flow batteries. A key advantage to flow batteries is that the storage system’s discharge duration can be increased by adding more electrolyte (and, if needed to hold the added electrolyte, additional electrolyte containers). It is also relatively easy to replace a flow battery’s electrolyte when it degrades.
Capacitors
Capacitors store electric energy as an electrostatic charge. An increasing array of larger capacity capacitors have characteristics that make them well-suited for use as energy storage. They store significantly more electric energy than conventional capacitors. They are especially well-suited to being discharged quite rapidly, to deliver a significant amount of energy over a short period of time (i.e., they are attractive for high-power applications that require short or very short discharge durations).
Compressed Air Energy Storage

Compressed Air Energy Storage
Compressed air energy storage (CAES) involves compressing air using inexpensive energy so that the compressed air may be used to generate electricity when the energy is worth more.
To convert the stored energy into electric energy, the compressed air is released into a combustion turbine generator system. Typically, as the air is released, it is heated and then sent through the system’s turbine. As the turbine spins, it turns the generator to generate electricity. For larger CAES plants, compressed air is stored in underground geologic formations, such as salt formations, aquifers, and depleted natural gas fields. For smaller CAES plants, compressed air is stored in tanks or large on-site pipes such as those designed for high-pressure natural gas transmission (in most cases, tanks or pipes are above ground).
Flywheel Energy Storage
Flywheel electric energy storage systems (flywheel storage or flywheels) include a cylinder with a shaft that can spin rapidly within a robust enclosure. A magnet levitates the cylinder, thus limiting friction-related losses and wear. The shaft is connected to a motor/generator. Electric energy is converted by the motor/generator to kinetic energy. That kinetic energy is stored by
increasing the flywheel’s rotational speed. The stored (kinetic) energy is converted back to electric energy via the motor/generator, slowing the flywheel’s rotational speed.
Pumped Hydroelectric
Key elements of a pumped hydroelectric (pumped hydro) system include turbine/generator equipment, a waterway, an upper reservoir, and a lower reservoir. The turbine/generator is
similar to equipment used for normal hydroelectric power plants that do not incorporate storage. Pumped hydro systems store energy by operating the turbine/generator in reserve to pump water uphill or into an elevated vessel when inexpensive energy is available. The water is later released when energy is more valuable. When the water is released, it goes through the turbine which turns the generator to produce electric power.
Superconducting Magnetic Energy Storage
The storage medium in a superconducting magnetic energy storage (SMES) system consists of a coil made of superconducting material. Additional SMES system components include power
conditioning equipment and a cryogenically cooled refrigeration system. The coil is cooled to a temperature below the temperature needed for superconductivity (the material’s ‘critical’ temperature). Energy is stored in the magnetic field created by the flow of direct current in the coil. Once energy is stored, the current will not degrade, so energy can be stored indefinitely (as long as the refrigeration is operational).
Thermal Energy Storage
There are various ways to store thermal energy. One somewhat common way that thermal energy storage is used involves making ice when energy prices are low so the cold that is stored can be used to reduce cooling needs – especially compressor-based cooling – when energy is expensive.
SOURCE: Overview of wind power storage media
.
Related articles
- Storage Systems
- Introduction To Micro Hydropower
- Shielding Of Power Cables
- Wind Power Applications
- APC Galaxy 7000™ UPS 250-500kVA
5,612 views

Siemens TechTopic | Bus Joint Fundamentals
Proper design of bus bar joints is a necessity for long equipment life. The objectives that a good bolted bus bar joint must fulfill include:
• It must provide good conductivity, so that the bus system will meet the temperature rise requirements in the ANSI standards.
• It must withstand thermal cycling, so that the low resistance joint will be maintained for the life of the equipment.
• The joint pressure should be high (for good conductivity), but not so high that cold flow of the bus material occurs, which would cause the joint to deteriorate with time.
•The joint should have good resistance to corrosion in normal installation environments.
• It must be able to withstand the mechanical forces and thermal stresses associated with short-circuit conditions.

Figure 1: Anatomy of a bolted bus bar joint
Figure 1 shows a bolted bus bar joint, simplified to show two bus bars connected using a single bolt. Except in rare situations, the bus bars are silver plated (standard) or tin plated (optional), to improve the resistance to corrosion. The bolt is a high strength grade 5 cap screw, while the nut is a grade 2 (heavy wall) nut. The joint includes a large diameter, thick flat washer on both sides of the joint, adjacent to the bus bars. A split lock washer is installed under the nut to assure that the joint stays tight over the life of the equipment.
Why do we use a grade 2 nut with a grade 5 bolt? The grade 2 nut is more ductile than the grade 5 bolt, so that when the nut is torqued in place, the threads in the nut will tend to be swaged down and burnished to a degree, which results in a more equal distribution of load on all threads. This spreads the force more evenly and avoids unacceptable stress levels in the bolt and the nut.
Some users request that special non-magnetic hardware be used in bus joints. Historically, particularly in open bus systems exposed to the weather, difficulties were encountered with corrosion, and this may be one reason that some still ask for non-magnetic hardware. Others prefer non-magnetic hardware because of the perception that it results in a lower temperature rise. While these reasons may have had merit decades ago, we feel they are unnecessary today. Non-magnetic hardware (usually stainless steel or silicon bronze) is expensive and difficult to obtain. In addition, the tensile strength and yield strength of non-magnetic hardware is lower than that of high strength steel, so that tightening torques will generally be lower with the special hardware. The net effect of lower torque and pressure may very well counterbalance any slight temperature rise benefit associated with non-magnetic hardware.
We also specify that the flat washers are to have larger diameter and greater thickness than standard washers. The purpose of the washers is to distribute the clamping force of the bolts over a wider area. To accomplish this, we need a washer that is relatively rigid, with a larger diameter than would be normal for the size bolt used. If a normal small diameter, thin washer (or worse, none at all) is used, the joint will deteriorate over time because of cold flow of copper from the high pressure region directly under the bolt head (or the nut).
.

Figure 2: Distribution of forces in a bolted bus bar joint
Figure 2 shows the distribution of forces in a bolted bus bar joint. To obtain a low resistance bus bar joint, we must establish and maintain sufficient pressure, and distribute the pressure over a large area. Initially, the two bus bars mate at only a few peaks or high spots. As the bolt is tightened, the bus conductors begin to deform, bringing more of these peaks into contact. At the design pressure, there is a relatively larger contact area, so that there are a multitude of parallel electrical connections between the bars.
As shown in figure 2, the force is concentrated more heavily around the bolt hole. Since the pressure is highest in the vicinity of the bolt hole, the surface irregularities in this area are flattened out as the mating surfaces are forced into more intimate contact. The joint resistance in this area will be lower than elsewhere in the joint. As distance from the bolt hole increases, pressure decreases and joint resistance increases. Beyond the area defined by the washer, pressure decreases rapidly and little effective current carrying capacity results.
From figure 2, we can see how the large diameter washers serve to distribute the clamping force more uniformly over a wider area than would be the case with a smaller washer, or none at all.
A properly designed bolted bus bar joint will allow the bus system to meet the temperature rise limits imposed by the ANSI standards, and will also have the thermal and mechanical capability to withstand the heat generated and forces imposed under the worst case short-circuit conditions.
.
SOURCE: T. W. (Ted) Olsen – Manager, Technology | Siemens Power Transmission & Distribution, Inc.
.
Related articles
- Caterpillar C175 Diesel Generator
- Hydropower – Systems Overview (2)
- Substation ventilation
- Comparison Between Vacuum and SF6 Circuit Breaker
23,406 views

Paralleling Three-Phase Transformers
Two or more three-phase transformers, or two or more banks made up of three single-phase units, can be connected in parallel for additional capacity.
In addition to requirements listed above for single-phase transformers, phase angular displacements (phase rotation) between high and low voltages must be the same for both.
The requirement for identical angular displacement must be met for paralleling any combination of three-phase units and/or any combination of banks made up of three single-phase units.
CAUTION:
This means that some possible connections will not work and will produce dangerous short circuits. See table 2 below.
For delta-delta and wye-wye connections, corresponding voltages on the high-voltage and low-voltage sides are in phase.
This is known as zero phase (angular) displacement. Since the displacement is the same, these may be paralleled. For delta-wye and wye-delta connections, each low-voltage phase lags its corresponding high-voltage phase by 30 degrees. Since the lag is the same with both transformers, these may be paralleled.
A delta-delta, wye-wye transformer, or bank (both with zero degrees displacement) cannot be paralleled with a delta-wye or a wye-delta that has 30 degrees of displacement. This will result in a dangerous short circuit.
 Figure 20 – Delta-Wye and Wye-Delta Connections Using Single- Phase Transformers for Three-Phase Operation.
Note: Connections on this page are the most common and should be used if possible.
Table 1 shows the combinations that will operate in parallel, and table 2 shows the combinations that will not operate in parallel.
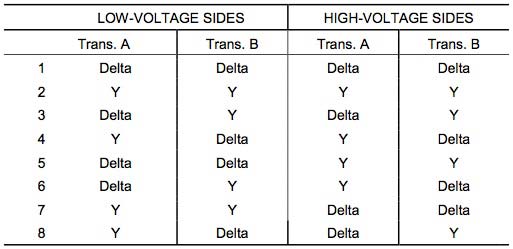 Table 1 – Operative Parallel Connections of Three-Phase Transformers
.
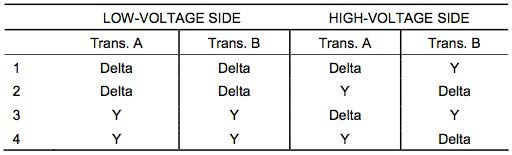 Table 2 – Inoperative Parallel Connections of Three-Phase Transformers
Wye-wye connected transformers are seldom, if ever, used to supply plant loads or as GSU units, due to the inherent third harmonic problems with this connection. Delta-delta, delta-wye, and wye-delta are used extensively at Reclamation facilities. Some rural electric associations use wye-wye connections that may be supplying reclamation structures in remote areas.
There are three methods to negate the third harmonic problems found with wye-wye connections:
- Primary and secondary neutrals can be connected together and grounded by one common grounding conductor.
- Primary and secondary neutrals can be grounded individually using two grounding conductors.
- The neutral of the primary can be connected back to the neutral of the sending transformer by using the transmission line neutral.
In making parallel connections of transformers, polarity markings must be followed. Regardless of whether transformers are additive or subtractive, connections of the terminals must be made according to the markings and according to the method of the connection (i.e., delta or wye).
CAUTION:
As mentioned above regarding paralleling single-phase units, when connecting additive polarity transformers to subtractive ones, connections will be in different locations from one transformer to the next.
.
Related articles
- Superconducting transformers
- Arc-resistant low voltage switchgear
- Substation, Its Function And Types
- General about motors
- History Of The Power Substations
12,081 views

Guide To Low Voltage Busbar Trunking Systems
Modern electrical desdign and installations are often placing increasing demands on all products of the electrical equipment manufacturer.
Products must have:
• Reliable service life
• Adaptability to new requirements
• Low installation costs
• Low maintenance costs
• Inherent safety features
• Minimal purchase cost
• Energy efficiency
.
In today’s market one of the most important elements is cost effectiveness. In an electrical installation, one area where savings can be made and provide the features listed above is in the use of busbar trunking systems. Busbar trunking installations can be categorised into two basic types:
- Distribution
- Feeder
Distribution Feeder
This is the most common use of busbar trunking and is applied to distribute power over a predetermined area. Busbar trunking can be run vertically or horizontally, or a combination of both. Typical applications would be:
- Supply to large numbers of light fittings
- Power distribution around factories and offices
- Rising main in office blocks or apartment blocks to supply distribution boards serving individual floors.
Power is taken from busbar trunking by the use of tap off units which connect at defined positions along the busbar trunking, and allow power to be taken from the system, usually via a suitable protective device.
Advantages over cable:
- The contractor can achieve savings with respect to material i.e. cable trays and multiple fixings and also labour costs associated with multiple runs of cable.
- Reduced installation time since busbar trunking requires less fixings per metre run than cable.
- Multiple tap-off outlets allow flexibility to accommodate changes in power requirements subsequent to the initial installation (subject to the rating of the busbar trunking).
- Repositioning of distribution outlets is simpler
- System is easily extendable.
- Engineered product with proven performance.
- Type tested to recognised international and national standards.
- Aesthetically pleasing in areas of high visibility.
Feeder Trunking
When used for the interconnection between switchboards or switchboard and transformer, busbar trunking systems are more economical to use, particularly for the higher current ratings, where multiple single core cables are used to achieve the current rating and compliance with voltage drop and voltage dip requirements.
Beside this, bunch of cables are increasing possiblity of heating between cables and eventually short circuit.
.
Advantages over cable:
- Greater mechanical strength over long runs with minimal fixings resulting in shorter installation times.
- Replaces multiple runs of cable with their associated supporting metalwork.
- Easier to install compared to multiples of large cables with all of the associated handling problems.
- Less termination space required in switchboards.
- Type tested short circuit fault ratings.
- Takes up less overall space, bends and offsets can be installed in a much smaller area than the equivalent cable space.
- Cable jointer not required.
- Busbar trunking systems may be dismantled and re-used in other areas
- Busbar trunking systems provide a better resistance to the spread of fire.
- Voltage drop and voltage dip in the majority of cases is lower than the equivalent cable arrangement.

- Typical Busbar Layout
Tap-Off Units
Tap-off units are of two types, either plug-in or fixed. Plug-in units are designed to be accommodated at tap-off outlets at intervals along the distribution busbar trunking. Fixed tap-off outlets are engineered and positioned during manufacture to suit the specified installation. The tap-off unit usually contains the device providing protection to the outgoing circuit terminated at the unit to distribute power to the required load.
There are various types of protective devices, for example:
1. HRC fuses to BS EN 60269-1 (BS88)
2. Miniature Circuit Breakers to BS EN 60898
3. Moulded Case Circuit Breakers to BS EN 60947-2
HRC fuses may be incorporated into fuse combination units to BS EN 60947-3. The degree of enclosure protection of the tap-off unit is defined by BS EN 60529.
Each tap-off unit contains the necessary safety features for systems and personnel protection, as follows:
- Plug-in units are arranged to be non-reversible to ensure that they can only be connected to give the correct phase rotation.
- Plug-in units are arranged to connect the protective circuit before the live conductors during installation and disconnect the protective circuit after the live conductors while being removed.
- Where units are provided with a switch disconnector or circuit-breaker these are capable of being locked in the OFF position.
- Covers permitting access to live parts can only be removed by the use of a tool and will have any internally exposed live parts shielded to a minimum of IP2X or IPXXB in accordance with BS EN 60529.
- Outgoing connection is achieved by cable terminations in the unit or by socket outlets to BS EN 60309-2 or BS 1363.
Fire Stops
Recommendations for the construction of fire-stops and barriers where trunking penetrates walls and floors classified as fire barriers. Internally the trunking may or may not require fire-stop measures according to the construction; where they are required these will generally be factory-fitted by the manufacturer and positioned according to a schematic drawing for the installation. Compact or sandwich-type trunking does not require internal fire-barriers, as suitability as a fire-barrier is inherent in the design.
However in all cases verification of the performance of the trunking under fire conditions needs to be provided by the manufacturer.
The following information is provided for guidance, and the method used should be agreed with the trunking manufacturer. It is not the responsibility of the trunking manufacturer to provide the specification or detail the rating or construction of the fire-stop external to the trunking.
Protective Earth Condustor Sizes
The sealing external to the busbar trunking (with or without an internal fire barrier) will need to conform to applicable building regulations. This may require filling the aperture around the busbar trunking with material to maintain the same fire proofing as the wall or floor.
Careful consideration needs to be given to the access required to complete the fire- stop. It may be necessary to install sections of fire-stop at the stage of installation of the trunking if access afterwards is impossible e.g. trunking runs in close proximity.
The protective earth connection(s) to the busbar trunking system shall conform to Section 543-01 of BS 7671 (IEE Wiring Regulations Sixteenth Edition).
Low-Noise Earth Systems
A low-noise earth, commonly referred to as a ‘clean earth’, is typically specified when electronic apparatus supplied from the system is sensitive to spurious voltages arising on the system earth. This is particularly true with IT equipment, found in all commercial premises these days, where data processing functions can be corrupted.
The low-noise earth is provided by a conductor separated from the protective earth (PE) and from all extraneous earth paths throughout the distribution system.
Many busbar trunking systems provide a ‘clean earth’ conductor in addition to the three phase conductors plus neutral, using the case or an external conductor as PE.
Tap-off units must be specified as ‘clean earth’ for the circuits concerned since the separation of the earths must be maintained and an additional termination will be provided for the load circuit ‘clean earth’ conductor. Sizing of the ‘clean earth’ conductor is not specified in BS 7671 (IEE Wiring Regulations Sixteenth Edition) but the usual practice is to calculate the size in the same way as for the protective earth conductor.
Neutral Sizes/Harmonics
The designer of the electrical network specifies the size of the neutral conductor depending upon the network loading. Typically this tends to be a neutral conductor the same size as the phase conductors (i.e.100% neutral). As a minimum a 50% neutral may be specified.
The BS 7671 (IEE Wiring Regulations Sixteenth Edition) states “In a discharge lighting circuit and polyphase circuits where the harmonic content of the phase currents is greater than 10% of the fundamental current, the neutral conductor shall have a cross-sectional area not less than that of the phase conductor(s).”
With the increase of non-linear (almost anything electronic) single phase loads connected to a network, for example electronic ballasts in lighting fittings, or switch-mode power supplies (the type found in personal computers and servers) the total harmonic distortion is increased.
.
Related articles
- ABB Power Transformers – A guide to manufacturing
- Dry-Type disc wound transformers in MV applications
- Substation ventilation
- Arc-resistant low voltage switchgear
- Shielding Of Power Cables
84,786 views
There are two methods for indicating protection relay functions in common use. One is given in ANSI Standard C37-2, and uses a numbering system for various functions. The functions are supplemented by letters where amplification of the function is required. The other is given in IEC 60617, and uses graphical symbols. To assist the Protection Engineer in converting from one system to the other, a select list of ANSI device numbers and their IEC equivalents is given in Figure A2.1.
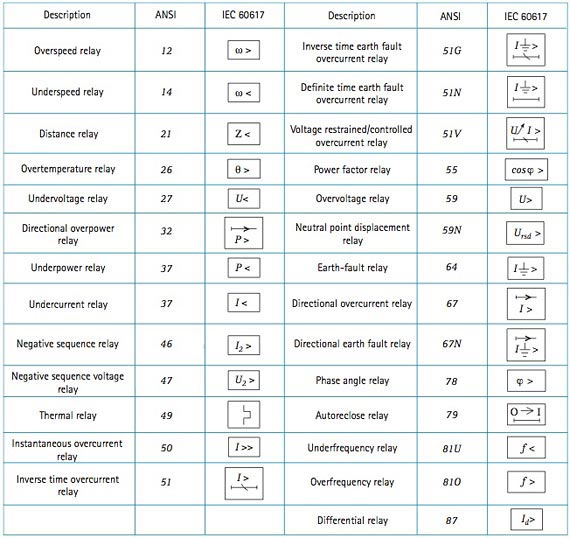
.
Related articles
- ANSI standards for protection devices
- Protection relays – important informations
- IEC standardi
- Arc-resistant low voltage switchgear
- Current Switching with High Voltage Air Disconnector
5,070 views

MOXA | Video Surveillance in Power Substations
Power substations play a crucial role in delivering electricity to consumers by converting transmission voltage to the lower voltage used in homes and businesses. Since power plants are often located far from the population centers they serve, electricity needs to be transmitted across long distances at a higher voltage.
Power lines deliver electricity from the plant to the power substations where it is converted before being distributed to the local community. It is therefore imperative that power substations are constantly monitored for safety and maintenance as they are often located near or in a populated area. This white paper explains the benefits of real-time video monitoring and IP video technology, as well as factors to consider in deploying an optimal IP video surveillance system for a power substation.
Video Surveillance Benefits
Since power substations are widely distributed and unmanned, remote monitoring is extremely crucial. Real-time video surveillance of power substations offers automatic monitoring and control capabilities in addition to enhancing remote monitoring applications with visual management. These capabilities not only save management costs for manpower, but also realize complete network automation.
Supervisory Control and Data Acquisition (SCADA) systems, which are already deployed in power substations to provide data about the system’s status, can be easily integrated with video surveillance technology. By installing a real-time video monitoring system at power substations, system administrators are able to receive visual data to complement the raw SCADA data. Real-time video monitoring can help ensure normal operations for power equipment, protect against intrusion and tampering by unauthorized personnel, and prevent accidents. For example, intruders, physical obstructions, or smoke indicating a fire can be seen via video so engineers no longer need to visit the site in-person each time to diagnose an anomaly, saving both time and costs.
Remote video surveillance systems can play an important role in monitoring equipment, detecting intruders, and responding to emergency situations. For example, video surveillance can be used to monitor the appearance of the power transformer and relay, fueling and flammable equipment, and the status of the isolation switch. Video surveillance can also monitor the security situation inside and outside the substation by detecting intruders through sound and visual monitoring. In addition, video surveillance can be integrated with the alarm system and RTU (remote terminal unit) over a SCADA system to provide real-time visual information to prevent accidents and assist emergency response personnel in the event of a fire.
Why IP Video?
In the past, video surveillance systems such as CCTV networks relied upon analog video cameras. Due to advances in video digitization and compression technologies, high quality digital video images can now be sent over Ethernet TCP/IP networks. By using such devices, system integrators can easily integrate video surveillance applications into their SCADA system. As a result, Internet Protocol (IP) video technology is the current trend in video surveillance systems. The benefits of IP video surveillance include:
One Network - Using the existing IP network saves cabling costs and increases installation flexibility, especially for widely distributed substations. Ethernet TCP/IP networks can accommodate a variety of I/O monitoring and control devices in addition to transmitting data, video, voice, and even power (PoE) over a single network.
One System - Integration with SCADA or alarm systems (such as fire, intrusion, etc.) increases monitoring efficiency and creates an event-driven video surveillance system. This means the video images can be displayed and recorded and real-time responses can be received when an event or alarm occurs.
Constructing an Optimal IP Video Surveillance System
Given the critical role played by power substations in our daily lives, it is important for the IP video solution to be well-designed to ensure that the video surveillance system works properly. System integrators should consider factors such as applicability, reliability, integration, and user-friendliness in order to construct an optimal IP video surveillance system.
Applicability – System integrators need to consider video requirements such as image viewing, recording, and analysis, as well as interoperability with other systems (such as SCADA, Access Control, etc.) when deploying an IP video surveillance system. They also need to know how many cameras are required for the system and whether IP cameras or video encoders are suitable for the application. Network transmission factors such as bandwidth, multicast, and IGMP requirements, and whether the project requires a single network or separate networks for data and video are also important. Central management concerns, including system resources (PCs, servers, cost, etc.), software requirements (pure video or video integrated with another system), storage capability and database management, and whether or not a decoder is required, should also be considered.
Reliability - Since video monitoring is used to ensure safety and security in remote and disperse locations, reliability is a key factor in designing an optimal IP video surveillance system. Factors for reliability include surge protection and fiber transmission to reduce electromagnetic interference. Redundancy, high MTBF (meantime between failures) and IP protection are also important factors to consider for optimal reliability.
Integration - System integrators should consider integrating video surveillance into the central management system, as well as other systems, including SCADA/HMI, remote monitoring, and access control. This not only reduces cabling and network installation costs, but also makes central management and control easier to handle for system administrators. Interoperation with other devices for event-driven video monitoring is another benefit. For example, the system can begin recording video once a card reader or sensor is activated.
User-friendliness - IP video involves new applications and technologies that power system administrators need to learn. For this reason, it is recommended that system integrators choose ready-to-use hardware and software solutions to reduce the time needed to set up an IP video surveillance system. Not only does this simplify the system integrator’s task, but it will also be easier for system administrators to learn and use.

Video Surveillance in Power Substations
VPort Solutions
Moxa’s VPort industrial video networking solutions include video encoders and decoders, IP cameras, and IP video surveillance software designed for mission-critical video surveillance applications. Since most mission-critical application environments are demanding, the rugged design features of Moxa’s VPort solutions are particularly suitable for these kinds of applications.
Video servers – Digital video images require large data files, so video compression (reducing the quantity of data used to represent video images) is required for transmission and storage. Video servers include encoders and decoders. Encoders are used to convert analog video images from cameras into an easy to transfer digital format such as MJPEG or MPEG4. Decoders are used to convert images from compressed formats (MJPEG or MPEG4) back into analog for use with legacy monitors or displays.
IP cameras – IP cameras bypass the need for video encoders because the images are automatically encoded into a digital format (MJPEG or MPEG4) by the camera itself, and are easily transferred via Ethernet/Internet. Moxa’s VPort series of IP camera offers a wide operating temperature range of -40 to 50°C without the need for a fan or heater, IP66-rating for rain and dust protection, one camera lens for both day and night use, up to 30 frames per second at 720 x 480 resolution, and direct-wired power input and PoE (power over Ethernet) for power redundancy. Moxa’s industrial-grade video servers offer 12/24 VDC or 24 VAC redundant power inputs, DIN-Rail mounting and panel mounting accessories, IP30 protection, -40 to 75°C operating temperature range for T models, and RJ45 or fiber optic Ethernet ports.
Software – Moxa’s SoftDVR Surveillance Software, which includes SoftDVR Lite (4-ch) and SoftDVR Pro (16-ch), is designed for IP-based video surveillance systems. The client/server-based network infrastructure makes it easy to build a user-friendly video surveillance system. SoftDVR offers multi-screen viewing, event-driven recording, easy to use search and playback, data storage to network hard disks, scheduling feature for recording and alarm activation, and remote access by web browser.
SDK – Most video surveillance systems require customized video management functions, or must be integrated with other applications such as SCADA, access control systems, and fire alarms. For this reason, a user-friendly SDK (software development kit) is a good tool to have available for building customized video management systems. Moxa’s VPort SDK, which includes CGI Commands, ActiveX, and a C library, is available free of charge to system integrators and third-party software developers. Learning to use the Moxa VPort SDK is easy, and detailed documentation and sample code is provided for quick reference.
Summary
Transmitting video, voice, and data simultaneously over Ethernet/Internet is becoming a standard feature due to the ever-increasing popularity of IP networks. Versatile and advanced video digitizing and compression technologies, such as MJPEG and MPEG4, are also making it possible to migrate analog CCTV surveillance systems to IP-based platforms.
Power substations play an instrumental role in delivering electricity from power plants to end-users, so managing and ensuring the safety and security of these installations through an optimal video surveillance system is imperative. Since power substations are unmanned and widely distributed installations, video surveillance grants system administrators visual management capabilities in addition to data management provided by existing central control systems that only provide raw quantitative data. The versatility of IP video technology and its ability to be integrated with existing central control systems make it an attractive option for remote video monitoring in power substation applications.
.
SOURCE: MOXA, Harry Hsiao, Product Manager at Moxa; www.moxa.com; harry.hsiao@moxa.com
.


